. 2019 Jan 24;9(1):654.
doi: 10.1038/s41598-018-36939-3.

Scanning the genomes of parents for imprinted loci acting in their un-genotyped progeny

Affiliations

Scanning the genomes of parents for imprinted loci acting in their un-genotyped progeny

Inga Blunk et al. Sci Rep. .

Abstract

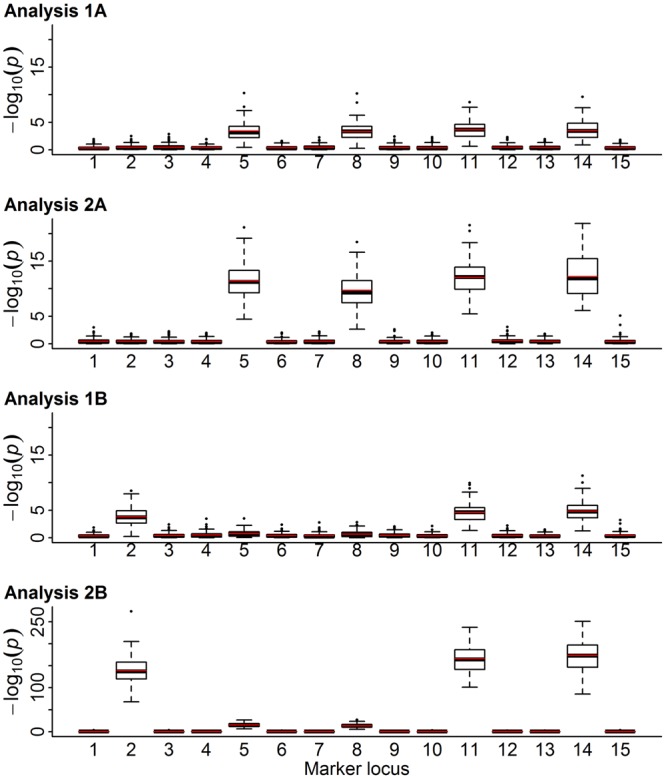
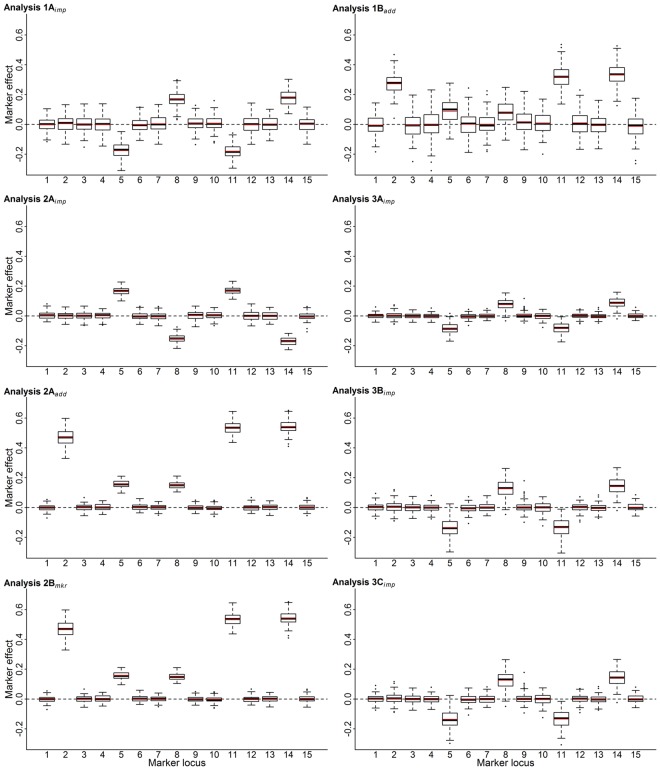
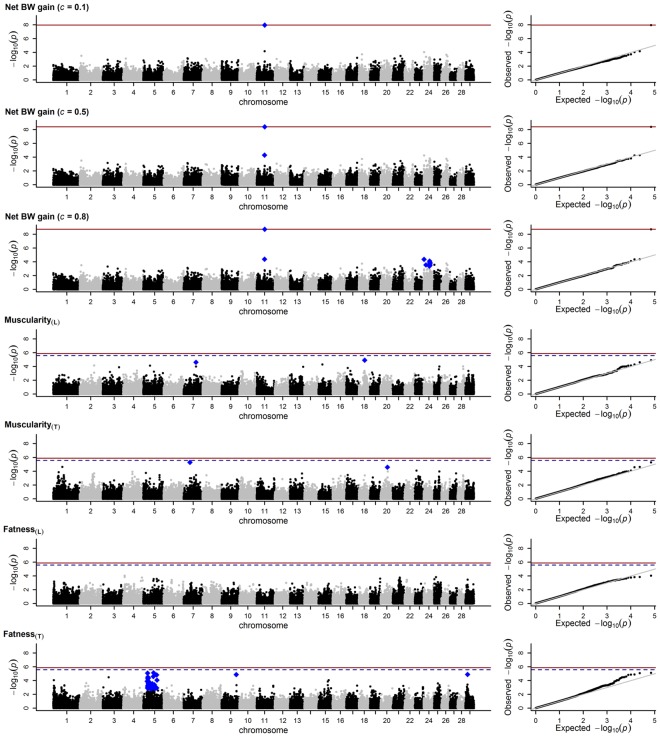
Depending on their parental origin, alleles at imprinted loci are fully or partially inactivated through epigenetic mechanisms. Their effects contribute to the broader class of parent-of-origin effects. Standard methodology for mapping imprinted quantitative trait loci in association studies requires phenotypes and parental origin of marker alleles (ordered genotypes) to be simultaneously known for each individual. As such, many phenotypes are known from un-genotyped offspring in ongoing breeding programmes (e.g. meat animals), while their parents have known genotypes but no phenotypes. By theoretical considerations and simulations, we showed that the limitations of standard methodology can be overcome in such situations. This is achieved by first estimating parent-of-origin effects, which then serve as dependent variables in association analyses, in which only imprinted loci give a signal. As a theoretical foundation, the regression of parent-of-origin effects on the number of B-alleles at a biallelic locus - representing the un-ordered genotype - equals the imprinting effect. The applicability to real data was demonstrated for about 1800 genotyped Brown Swiss bulls and their un-genotyped fattening progeny. Thus, this approach unlocks vast data resources in various species for imprinting analyses and offers valuable clues as to what extent imprinted loci contribute to genetic variability.


Conflict of interest statement

The authors declare no competing interests.

Figures

Figure 1
Figure 1
Boxplots of the −log10 p-values and their means (red line) for 15 markers in simulated two-generation population (with 100x replications) from different kinds of analyses: Estimates of the parent’s parent-of-origin effects (analysis 1A) and transmitting abilities (analysis 1B) were regressed on their un-ordered genotype; phenotypes of offspring were regressed on their own ordered genotype (analysis 2A) and un-ordered genotype (analysis 2B). Quantitative trait loci (QTLs) showed biparental, paternal, maternal, partial paternal and partial maternal expression patterns at markers 2, 5, 8, 11 and 14, respectively; no other markers were associated with any QTL.
Figure 2
Figure 2
Boxplots of the marker effects and their means (red line) for all analyses and markers linked to quantitative trait loci (QTLs) with biparental (marker 2), paternal (marker 5), maternal (marker 8), partial paternal (marker 11) and partial maternal (marker 14) expression patterns. Subscripts imp and add indicate separate tests related to imprinting, or Mendelian effects, while mkr indicates an unspecified single effect marker test from model 2B. Estimates of the parent’s parent-of-origin effects (1A) and transmitting abilities (1B) were regressed on their un-ordered genotype; phenotypes of offspring were regressed on their own ordered (2A) and un-ordered genotype (2B). Estimated parent-of-origin effects were analysed untreated (3A), deregressed and corrected for parent average (3B), and deregressed, corrected for parent-average and weighted (3C).
Figure 3
Figure 3
Marker loci in relation to their −log10 p-values generated by regressing estimated parent-of-origin effects (ePOEs) on marker genotypes. Net body weight (BW) gain was analysed with varying c-parameters of 0.1, 0.5 and 0.8. The ePOEs for carcass muscularity and carcass fatness were generated using a linear (subscript L) and threshold model (subscript T). Red line = 5% genome-wide false discovery rate (FDR); dashed line = 10% genome-wide FDR; blue diamonds = markers significant assuming a chromosome-wide FDR of 5%.
Figure 4
Figure 4
Marker loci in relation to their −log10 p-values generated by regressing transmitting abilities (TAs) as sire on marker genotypes. The TAs for carcass muscularity and carcass fatness were generated using a linear (subscript L) and threshold model (subscript T). Red line = 5% genome-wide false discovery rate (FDR); dashed line = 10% genome-wide FDR; blue diamonds = markers significant assuming a chromosome-wide FDR of 5%.

References

    1. Lawson HA, Cheverud JM, Wolf JB. Genomic imprinting and parent-of-origin effects on complex traits. Nat. Rev. Genet. 2013;14:609–617. doi: 10.1038/nrg3543. - DOI - PMC - PubMed
    1. Ferguson-Smith AC. Genomic imprinting: the emergence of an epigenetic paradigm. Nat. Rev. Genet. 2011;12:565–575. doi: 10.1038/nrg3032. - DOI - PubMed
    1. Tuiskula-Haavisto M, et al. Quantitative trait loci with parent-of-origin effects in chicken. Genet. Res. 2004;84:57–66. doi: 10.1017/S0016672304006950. - DOI - PubMed
    1. Rowe SJ, Pong-Wong R, Haley CS, Knott SA, de Koning DJ. Detecting parent of origin and dominant QTL in a two-generation commercial poultry pedigree using variance component methodology. Genet. Sel. Evol. 2009;41:6. doi: 10.1186/1297-9686-41-6. - DOI - PMC - PubMed
    1. Frésard L, et al. Transcriptome-wide investigation of genomic imprinting in chicken. Nucleic Acids Res. 2014;42:3768–3782. doi: 10.1093/nar/gkt1390. - DOI - PMC - PubMed

Publication types