Observational Study
. 2019 Jan 24;9(1):509.
doi: 10.1038/s41598-018-36964-2.

Association between preterm delivery and bacterial vaginosis with or without treatment

Affiliations
Observational Study

Association between preterm delivery and bacterial vaginosis with or without treatment

Masao Shimaoka et al. Sci Rep. .

Abstract

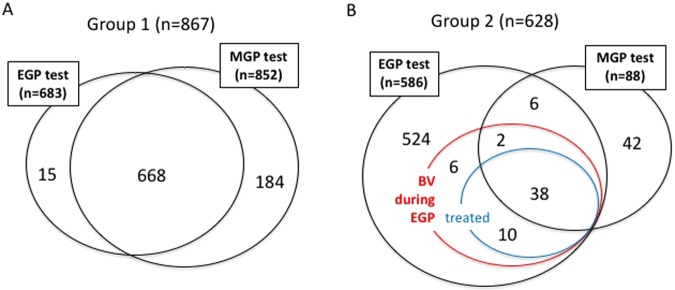
The relationship between bacterial vaginosis (BV) and preterm delivery has become well known in recent years, although there are few studies on: (i) the differences in test results during the early gestational (EGP) and middle gestational (MGP) periods; (ii) the significance of the intermediate (I) group that does not develop overt BV; or (iii) the therapeutic effects of metronidazole. We performed a retrospective study to analyze the relationship between the vaginal bacterial status and the preterm delivery rate. Without treatment, the preterm delivery rate was higher in the BV subgroup than in the I and normal (N) subgroups (p = 0.021) in the EGP, whereas the rates in the BV and I subgroups were higher than in the N subgroup in the MGP (p = 0.0003). Although treatment of BV by metronidazole vaginal tablets significantly increased the N subgroup in the MGP (p = 0.020), there was no significant improvement in the preterm delivery rate. Decreasing the rate of preterm delivery requires development of treatment methods that will further increase the percentage of patients who test N during the MGP after BV during the EGP.


Conflict of interest statement

The authors declare no competing interests.

Figures

Figure 1
Figure 1
Venn diagram to classify the group 1 and group 2 cases. (A) In principle, group1 cases underwent BV tests during both the EGP and the MGP. EGP tests, MGP tests, and both tests were performed for 683, 852, and 668 women, respectively. (B) In principle, group 2 cases underwent BV tests during the EGP, then BV cases were treated, followed by BV tests during the MGP. EGP tests and MGP tests were performed for 586 and 88 women, respectively. 56 women were BV positive during the EGP.
Figure 2
Figure 2
Outline of bacterial vaginosis (BV) exams in group 1. NS 7–10: bacterial vaginosis (BV); NS 4–6: intermediate (I); NS 0–3: normal (N). (A) Number of BV exams stratified by gestational week. (B) Comparison of ratios of BV, I and N cases between the early gestational period (EGP) and middle gestational period (MGP). (C) Change in Nugent score (NS) from EGP to MGP in 668 paired cases.
Figure 3
Figure 3
NS and ratio of preterm delivery in group 1. X-axis: gestational period. Y-axis: cumulative ratio of delivery. Cases are divided by (A) NS during the EGP (<20 weeks), (B) NS during the MGP (20–33 weeks) or C) NS during the EGP and MGP. The arrows indicate changes from the EGP to the MGP.
Figure 4
Figure 4
BV status and ratio of preterm delivery in group 2. X-axis: gestational period. Y-axis: cumulative ratio of delivery. (A) Comparison of the BV, I and N subgroups during the EGP. (B) Comparison of BV/I and N subgroups during the MGP. (C) Comparison of the BV/I and N subgroups during the MGP following BV treatment during the EGP.
Figure 5
Figure 5
Comparison between group 1 and group 2. (A) Ratio of preterm delivery among I/N patients during the EGP. (B) Ratio of preterm delivery among BV patients during the EGP. (B) Change in vaginal bacteria status of the BV patients from the EGP to the MGP. (C) A significant increase in N cases in group 2 compared with group 1 was observed. (D) Ratio of preterm delivery among BV patients during the EGP. In (A), (B), and (D), the X-axis shows gestational period. Y-axis: cumulative ratio of delivery.

References

    1. Freitas AC, et al. The vaginal microbiome of pregnant women is less rich and diverse, with lower prevalence of Mollicutes, compared to non-pregnant women. Sci. Rep. 2017;7:9212. doi: 10.1038/s41598-017-07790-9. - DOI - PMC - PubMed
    1. Romero R, et al. The composition and stability of the vaginal microbiota of normal pregnant women is different from that of non-pregnant women. Microbiome. 2014;2:4. doi: 10.1186/2049-2618-2-4. - DOI - PMC - PubMed
    1. Hibbard JU, Hibbard MC, Ismail M, Arendt E. Pregnancy outcome after expectant management of premature rupture of the membranes in the second trimester. J. Reprod. Med. 1993;38:945–951. - PubMed
    1. Goldenberg RL, Hauth JC, Andrews WW. Intrauterine infection and preterm delivery. N. Engl. J. Med. 2000;342:1500–1507. doi: 10.1056/NEJM200005183422007. - DOI - PubMed
    1. Gonçalves LF, Chaiworapongsa T, Romero R. Intrauterine infection and prematurity. Ment. Retard. Dev. Disabil. Res. Rev. 2002;8:3–13. doi: 10.1002/mrdd.10008. - DOI - PubMed

Publication types

MeSH terms