. 2019 Jan 24;9(1):690.
doi: 10.1038/s41598-018-36873-4.

Stratification of amyotrophic lateral sclerosis patients: a crowdsourcing approach

Collaborators, Affiliations

Stratification of amyotrophic lateral sclerosis patients: a crowdsourcing approach

Robert Kueffner et al. Sci Rep. .

Abstract

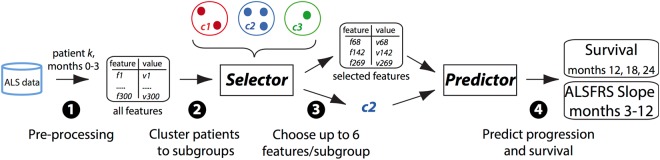
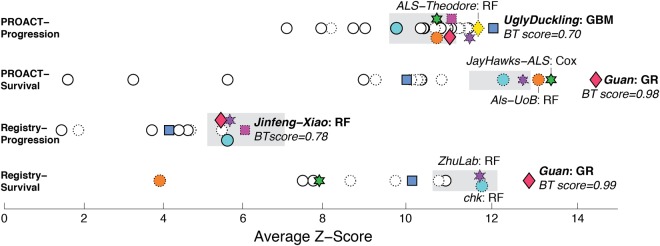
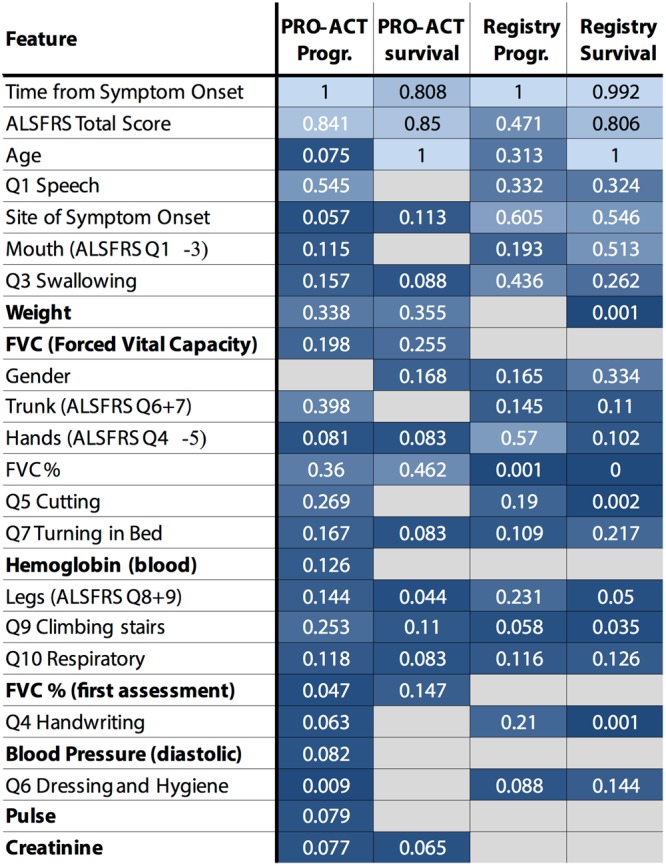
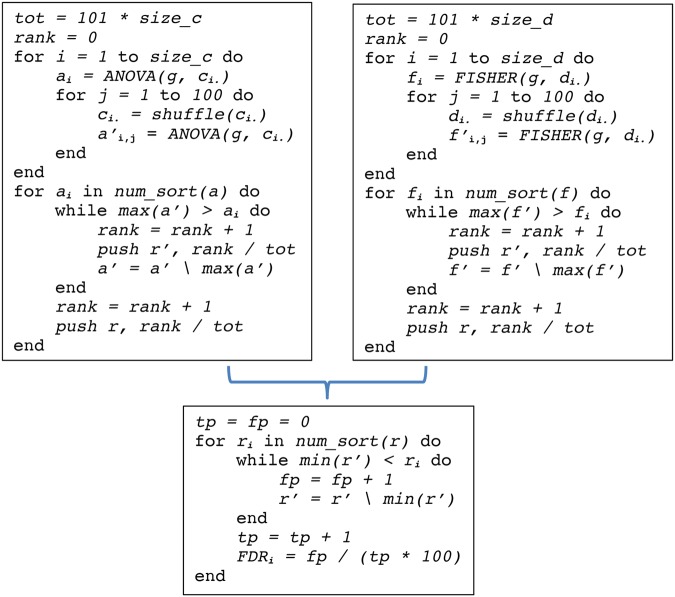
Amyotrophic lateral sclerosis (ALS) is a fatal neurodegenerative disease where substantial heterogeneity in clinical presentation urgently requires a better stratification of patients for the development of drug trials and clinical care. In this study we explored stratification through a crowdsourcing approach, the DREAM Prize4Life ALS Stratification Challenge. Using data from >10,000 patients from ALS clinical trials and 1479 patients from community-based patient registers, more than 30 teams developed new approaches for machine learning and clustering, outperforming the best current predictions of disease outcome. We propose a new method to integrate and analyze patient clusters across methods, showing a clear pattern of consistent and clinically relevant sub-groups of patients that also enabled the reliable classification of new patients. Our analyses reveal novel insights in ALS and describe for the first time the potential of a crowdsourcing to uncover hidden patient sub-populations, and to accelerate disease understanding and therapeutic development.


Conflict of interest statement

The authors declare no competing interests.

Figures

Figure 1
Figure 1
Outline of algorithms design. Algorithms used either PRO-ACT or ALS registries data, and first (1) applied various data pre-processing and imputation methods. Next, (2) algorithms could cluster the patient population into any number of sub-groups and (3) select the most informative features for each cluster (up to a maximum of 6 features). Then (4) a “predictor” component had to use values of the selected features to predict either disease progression or survival for any given patient. In the scoring of the challenge, the algorithms made predictions for patients that were not part of the original datasets available for algorithms training, and the accuracy of these predictions was assessed.
Figure 2
Figure 2
Overview of the performance of submitted and baseline algorithms across the four sub-challenges. Submissions were assessed by Z-scores combining RMSD, concordance index and Pearson’s correlation (see online methods for details on validation and testing). Performance was also compared to two baseline algorithms which were based on the top performing prediction algorithms submitted to the 2012 ALS prediction challenge, adapted to the requirements of the new challenge (see Supplementary material part 4). Grey boxes denote the performance of the best-performing baseline algorithm (left and right boundary of the box represent intervals of its performance ± the bootstrapped standard deviation). Teams that achieved the top three scores in any sub-challenge are indicated by colored symbols and shown by the same symbol in all sub-challenges. The BT score (right side of the figure) denotes the percentage of bootstrap samples where the top ranking team outperformed the second ranking team. The underlying method is indicated (RF = random forest, GBM = generalized boosting model, Cox = Cox model, GR = Gaussian regression). Submissions based on random forests, the most frequently used method, are denoted by symbols with dashed outlines.
Figure 3
Figure 3
Overview of the features most frequently used by the algorithms within and across subchallenges. For each subchallenge, we assessed the number of times each feature was used for prediction across all submitted algorithms (shown as probability. The features are ranked-ordered by this probability, averaged across all sub-challenges where darker colors denote lower probabilities). Cases where a given feature was not used at all for a given sub-challenge are shown in grey (probability 0). Features that are recommended to be assessed by clinicians more often to aid prognosis are marked in bold.
Figure 4
Figure 4
Overview of the consensus clustering. (a) Outline of consensus clustering method: the tendency of patients to co-cluster was assessed across cluster-sets generated independently by the different solvers (I). The resulting connectivity matrix (II) was then used as input for obtaining consensus clusters (III) by k-means. Finally, False discovery rates (FDRs) were estimated by ANOVA (IV) on 100 randomized datasets to assess, which features were differentially distributed between consensus clusters, see online methods and Supplementary material part 6. (b) Graph-based clustering of the connectivity matrix for the PRO-ACT progression sub-challenge. Nodes in the graph represent patients and are colored based on their k-means cluster, if they correspond to the 50% of “core” patients closest to their respective cluster centroid. Edges denote pairs of patients with a significant chance of being co-clustered by solvers. (c) We compared features (names starting with Q/R are ALSFRS component scores from the original or revised scale) between pairs of clusters (columns in heatmap) by t-tests/FDRs. Different colors within heatmap rows indicate values that are significantly different between clusters (FDR < 5%) on the scale from the lowest (blue) to highest (red). Notable results are listed explicitly in Panel b.
Figure 5
Figure 5
Pseudo code analysis of differentially distributed features. The pseudocode in the left panel illustrates the computation of the ANOVA test statistic a at the example of the continuous features in C. The design g specifies the mapping of patients to clusters. A permuted test is calculated by shuffling values in rows of the matrix C 100 times, computing their associated test statistics a’ and pushing their relative ranks and the relative ranks of a separately into arrays r’ and r, respectively. The backslash notation denotes the removal of an element, i.e. in a’ = a’\max(a’), the entry with the highest value is removed from a’. Analogously, the Fisher test statistic f is calculated for the discrete features in D (pseudo code in the right panel). Finally, FDRs are calculated by comparing the relative ranks from the true statistics r vs. the relative ranks from the permuted statistics r’ across discrete and continuous features (pseudocode in lower panel).

References

    1. Swinnen B, Robberecht W. The phenotypic variability of amyotrophic lateral sclerosis. Nat Rev Neurol. 2014;10:661–70. doi: 10.1038/nrneurol.2014.184. - DOI - PubMed
    1. Miller, R. G., Mitchell, J. D., Lyon, M. & Moore, D. H. Riluzole for amyotrophic lateralsclerosis (ALS)/motor neuron disease (MND). Cochrane Database Syst Rev. CD001447 (2002). - PubMed
    1. Edaravone (MCI-186) ALS Study Group Safety and efficacy of edaravone in well defined patients with amyotrophic lateral sclerosis: a randomised, double-blind, placebo-controlled trial. Lancet Neurol. 2017;16:505–512. doi: 10.1016/S1474-4422(17)30115-1. - DOI - PubMed
    1. Ravits JM, La Spada AR. ALS motor phenotype heterogeneity, focality, and spread: deconstructing motor neuron degeneration. Neurology. 2009;73:805–11. doi: 10.1212/WNL.0b013e3181b6bbbd. - DOI - PMC - PubMed
    1. Logroscino G. Classifying change and heterogeneity in amyotrophic lateral sclerosis. Lancet Neurol. 2016;15:1111–2. doi: 10.1016/S1474-4422(16)30206-X. - DOI - PubMed