. 2019 Jan 24;9(1):565.
doi: 10.1038/s41598-018-37555-x.

Sonic hedgehog signaling is negatively regulated in reactive astrocytes after forebrain stab injury

Affiliations

Sonic hedgehog signaling is negatively regulated in reactive astrocytes after forebrain stab injury

R Vivian Allahyari et al. Sci Rep. .

Abstract

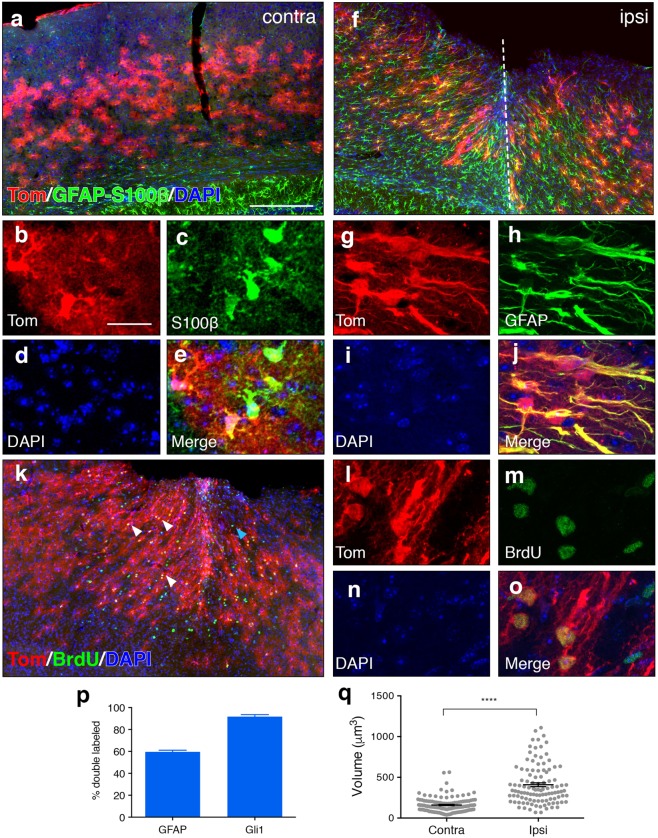
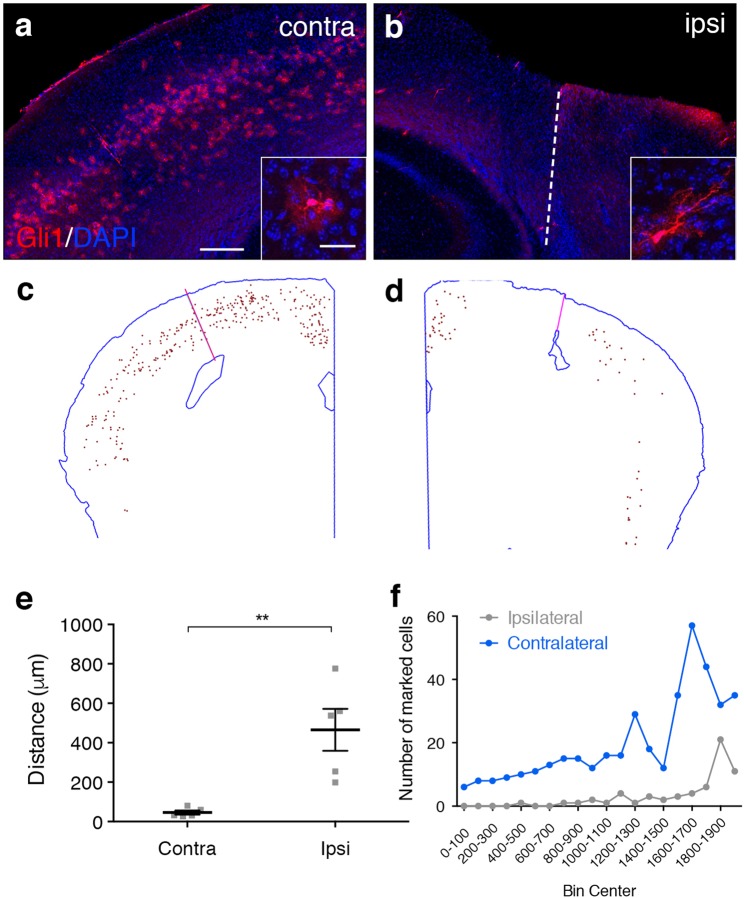
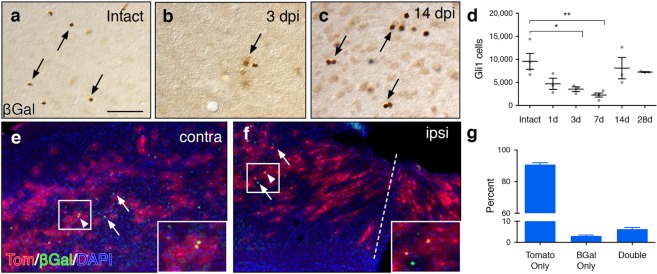
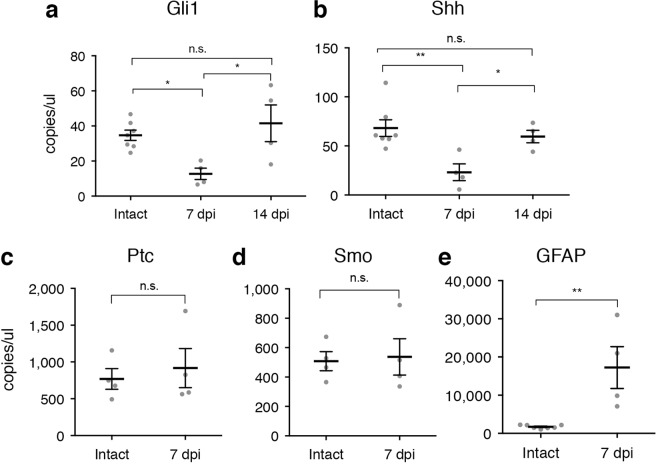
Following injury to the central nervous system, astrocytes perform critical and complex functions that both promote and antagonize neural repair. Understanding the molecular signaling pathways that coordinate their diverse functional properties is key to developing effective therapeutic strategies. In the healthy, adult CNS, Sonic hedgehog (Shh) signaling is active in mature, differentiated astrocytes. Shh has been shown to undergo injury-induced upregulation and promote neural repair. Here, we investigated whether Shh signaling mediates astrocyte response to injury. Surprisingly, we found that following an acute, focal injury, reactive astrocytes exhibit a pronounced reduction in Shh activity in a spatiotemporally-defined manner. Shh signaling is lost in reactive astrocytes at the lesion site, but persists in mild to moderately reactive astrocytes in distal tissues. Nevertheless, local pharmacological activation of the Shh pathway in astrocytes mitigates inflammation, consistent with a neuroprotective role for Shh signaling after injury. Interestingly, we find that Shh signaling is restored to baseline levels two weeks after injury, a time during which acute inflammation has largely subsided and lesions have matured. Taken together, these data suggest that endogenous Shh signaling in astrocytes is dynamically regulated in a context dependent manner. In addition, exogenous activation of the Shh pathway promotes neuroprotection mediated by reactive astrocytes.


Conflict of interest statement

The authors declare no competing interests.

Figures

Figure 1
Figure 1
Gli1 astrocytes marked before injury exhibit features of reactive astrocytes. (a,f) Low power micrographs from the contralateral (a) and ipsilateral (f) cortex of an adult Gli1CreER/+;R26tdTomato/tdTomato mouse that received tamoxifen 2 weeks before injury. Fluorescence immunohistochemistry for GFAP-S100β (green) shows that Gli1 astrocytes (red) at the lesion site upregulate GFAP and extend long radial processes towards the blade track (dashed line). (be,gj) Maximum projection images from confocal z-stacks showing colocalization of marked Gli1 astrocytes (red, b, g) and S100β or GFAP (green, c,h). Tissues counterstained with DAPI (blue, d,i). Merged image shown in (e,j). (k) Low power micrograph of tomato (red) and BrdU (green) labeled cells at the lesion site showing marked astrocytes at the lesion site proliferating. (lo) Maximum projection images from a confocal stack showing colocalization of tomato (red, l) and BrdU (green, m). Tissues counterstained with DAPI (blue, n). Merged image shown in (o). (p) Single cell analysis of the proportion of GFAP and Gli1 cells that are colabeled (n = 1,527 and n = 990 cells, respectively, from 3 animals). Error bars represent mean ± SEM. (q) Stereological estimates of cell body volume of marked cells in contralateral and ipsilateral hemispheres. Data points represent individual cells, bars represent mean ± SEM. Statistical signficance was assessed by unpaired Student’s t-test (p < 0.0001, n = 131 and n = 108 cells, respectively from 4 animals). Scale bars, 250 µm (a,f,k), 25 µm (begjlo).
Figure 2
Figure 2
Gli1 expression is lost in the lesion area. (a,b) Tomato expression (red) in the contralateral (a) and ipsilateral (b) cortex of an adult Gli1CreER/+;R26tdTom/tdTom mouse that received a single dose of tamoxifen on day 3 after injury. Dashed line indicates blade track. Insets show single cells from contralateral and ipsilateral hemispheres. Note the pronounced change in size and morphology of the marked cell in the ipsilateral, compared to the intact, contralateral hemisphere. Scale bar, 250 µm, inset, 50 µm. Counterstained with DAPI (blue). (c,d) Stereo Investigator tracings showing the distribution of Gli1 astrocytes throughout the contralateral (c) and ipsilateral (d) hemispheres from animals that received a single dose of tamoxifen at 3 dpi. Pink line denotes the actual or projected blade track. Note the pronounced absence of marked cells in the region immediately surrounding the lesion in the ipsilateral hemisphere, and a relative reduction in the number of marked cells throughout the ipsilateral cortex, relative to the intact, contralateral hemisphere. (e) The average distance from the actual or projected blade track to the first marked cell on the ipsilateral or contralateral hemispheres, respectively. Data points represent independent animals, bars represent mean ± SEM. Statistical significance assessed by unpaired Student’s t-test (p = 0.0004). (f) The number of marked cells throughout the ipsilateral and contralateral hemispheres, relative to their distance from the lesion, plotted in 100 µm bins. Pooled data from 4 animals.
Figure 3
Figure 3
Gli1 expression is downregulated in the lesion area. (ac) Brightfield immunohistochemistry for βGal in Gli1nLacZ/+ mice showing the number of Gli1 cells in the intact cortex (a), and at 3 (b) and 14 (c) days after injury. Scale bar, 50 µm. (d) Stereological quantification of the number of Gli1 cells in the lesion area. Data points represent individual animals, bars represent mean ± SEM. Statistical significance was assessed by one-way ANOVA, post-hoc Tukey’s multiple comparisons test (*p = 0.047, **p = 0.007). (e,f) Distribution of tomato (red) and βGal (green) labeled cells in the contralateral (e) and ipsilateral (f) hemispheres of a Gli1CreER/nLacZ;R26tdTom/+ mouse at 7 dpi. Tissues counterstained with DAPI (blue). A small fraction of βGal labeled cells do not co-express tomato (arrows). Double-labeled cells indicated by arrowheads. (g) The fraction of single and double labeled cells in the lesion area of the ipsilateral hemisphere (n = 1,464 cells analyzed from 4 animals). Note that the vast majority of marked cells in the lesion area do not co-express βGal (tomato only), reflecting the absence of βGal proximal to the lesion. Bars represent mean ± SEM.
Figure 4
Figure 4
Transcriptional loss of Shh and Gli1. Absolute quantification of transcripts of multiple components of the Shh signaling pathway (a,d) and GFAP (e) from the cortex of intact or injured mice at 7 and 14 dpi. Data points represent independent animals, bars represent mean ± SEM. Statistical significance was assessed by one-way ANOVA, with post-hoc Tukey’s multiple comparisons test (a,b), or unpaired Student’s t-test (ce); *p < 0.05, **p < 0.01.
Figure 5
Figure 5
Activation of Hh signaling attenuates leukocyte migration. (af) Low power epifluorescent (a,c,e) and high power, confocal images (b,d,f) of immunofluroescent double staining for CD45 (red) and GFAP (green) in the lesion area of wildtype (a-d), or Smo CKO (e, f) mice that received vehicle (a,b) or SAG (cf). Scale bar, 250 µm, (a,c,e); 50 µm, (b,d,f). Boxes in a, c, e depict regions analyzed in confocal images for CD45 quantification. Dotted lines indicate external capsule. (g) Stereological quantification of the estimated total number of BrdU cells in the lesion area. Data points represent individual animals, bars represent mean ± SEM. Statistical significance was assessed by Student’s t-test (p = 0.2569). (h) The number of CD45 labeled cells in parenchymal tissues adjacent to the lesion. Data points represent individual animals, bars represent mean ± SEM. Statistical significance was assessed by one-way ANOVA (p = 0.046), with post-hoc Tukey’s multiple comparisons test.

References

    1. Amankulor NM, et al. Sonic Hedgehog Pathway Activation Is Induced by Acute Brain Injury and Regulated by Injury-Related Inflammation. Journal of Neuroscience. 2009;29:10299–10308. doi: 10.1523/JNEUROSCI.2500-09.2009. - DOI - PMC - PubMed
    1. Bambakidis NC, Wang R-Z, Franic L, Miller RH. Sonic hedgehog-induced neural precursor proliferation after adult rodent spinal cord injury. Journal of neurosurgery. 2003;99:70–75. doi: 10.3171/spi.2003.99.1.0070. - DOI - PubMed
    1. Bambakidis NC, et al. Intravenous Hedgehog Agonist Induces Proliferation of Neural and Oligodendrocyte Precursors in Rodent Spinal Cord Injury. Neurosurgery. 2010;67:1709–1715. doi: 10.1227/NEU.0b013e3181f9b0a5. - DOI - PubMed
    1. Chechneva OV, et al. A Smoothened receptor agonist is neuroprotective and promotes regeneration after ischemic brain injury. Cell Death Dis. 2014;5:e1481. doi: 10.1038/cddis.2014.446. - DOI - PMC - PubMed
    1. Honsa P, et al. Generation of reactive astrocytes from NG2 cells is regulated by sonic hedgehog. Glia. 2016;64:1518–1531. doi: 10.1002/glia.23019. - DOI - PubMed

Publication types

MeSH terms

LinkOut - more resources