

Potential new biomarkers for endometrial cancer
- PMID: 30679932
- PMCID: PMC6341571
- DOI: 10.1186/s12935-019-0731-3
Potential new biomarkers for endometrial cancer
Abstract
Background: Incidence of endometrial cancer are rising both in the United States and worldwide. As endometrial cancer becomes more prominent, the need to develop and characterize biomarkers for early stage diagnosis and the treatment of endometrial cancer has become an important priority. Several biomarkers currently used to diagnose endometrial cancer are directly related to obesity. Although epigenetic and mutational biomarkers have been identified and have resulted in treatment options for patients with specific aberrations, many tumors do not harbor those specific aberrations. A promising alternative is to determine biomarkers based on differential gene expression, which can be used to estimate prognosis.
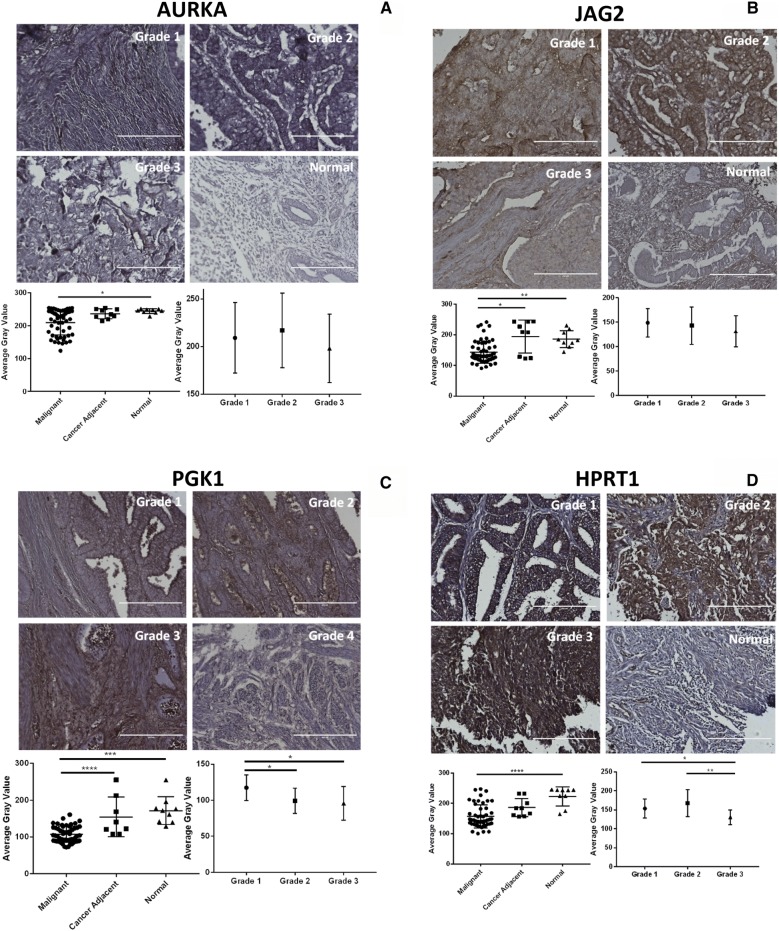
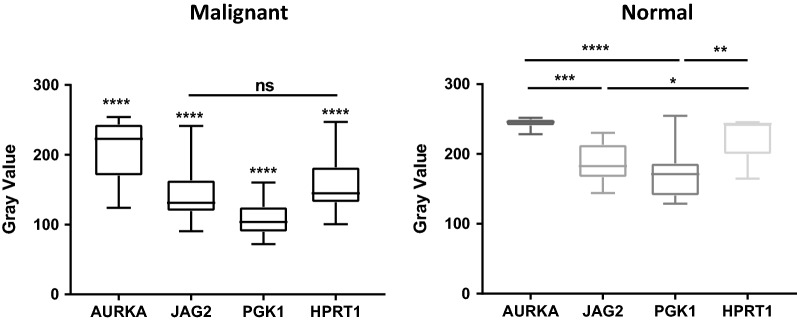
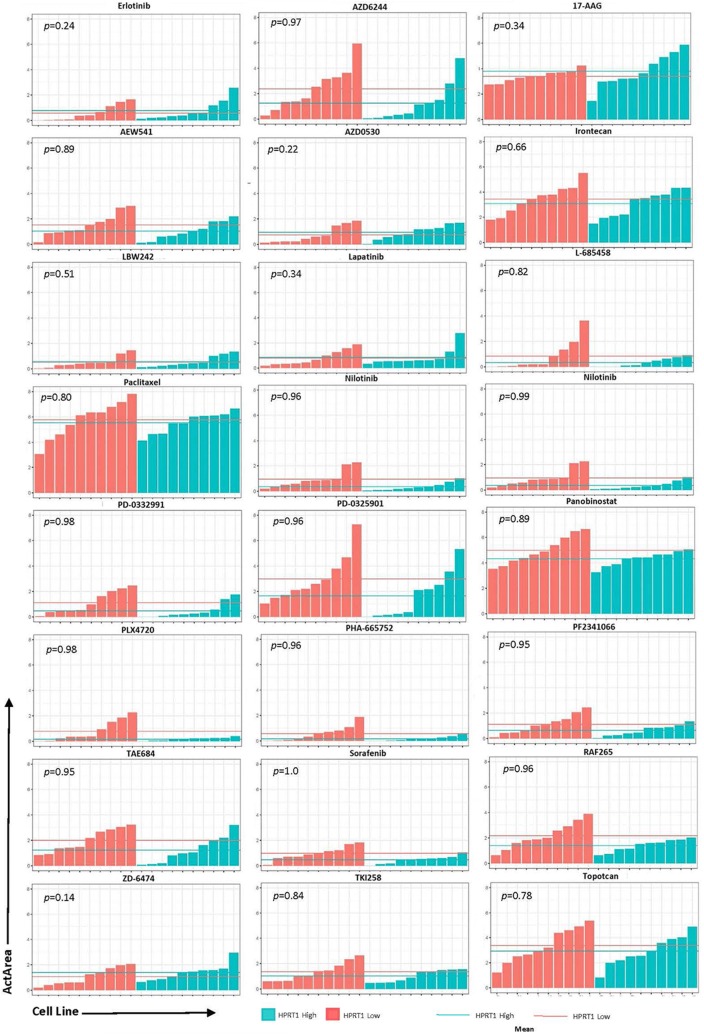
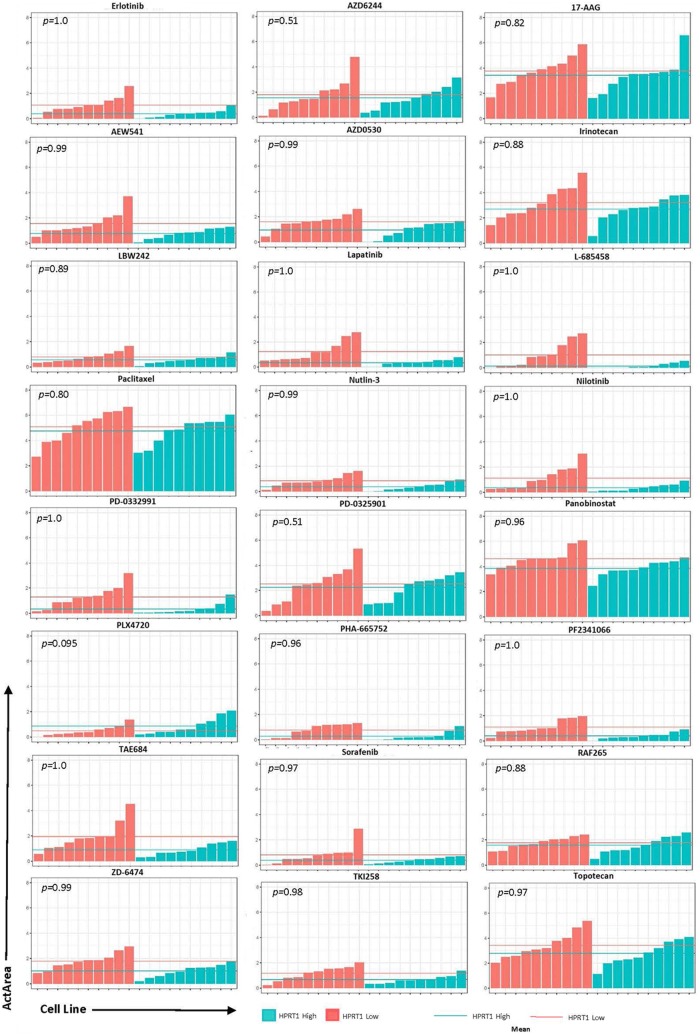
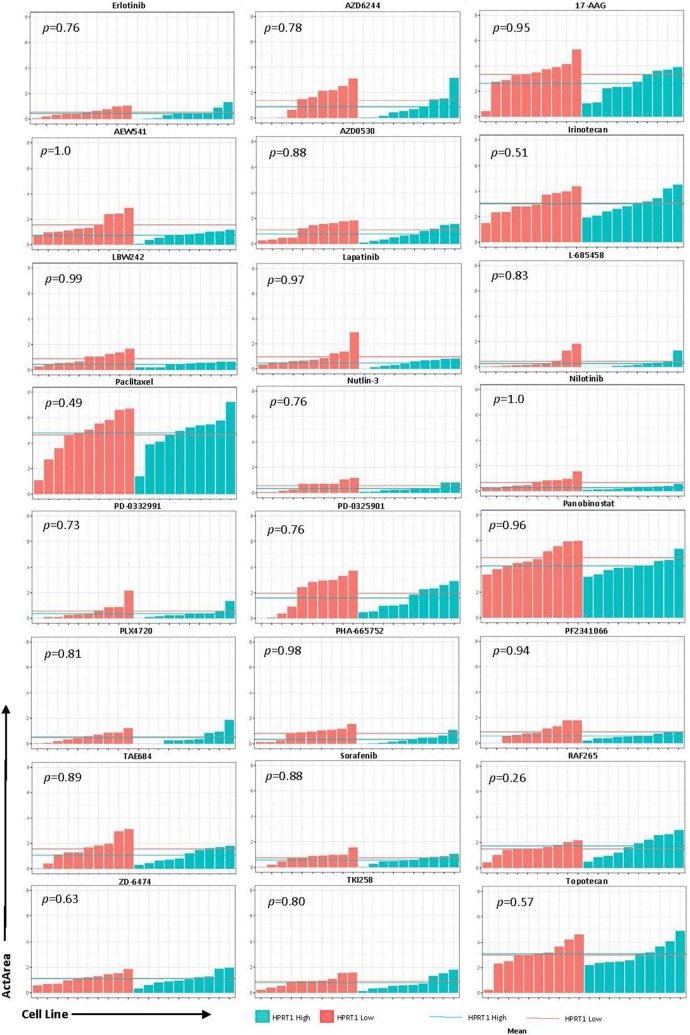
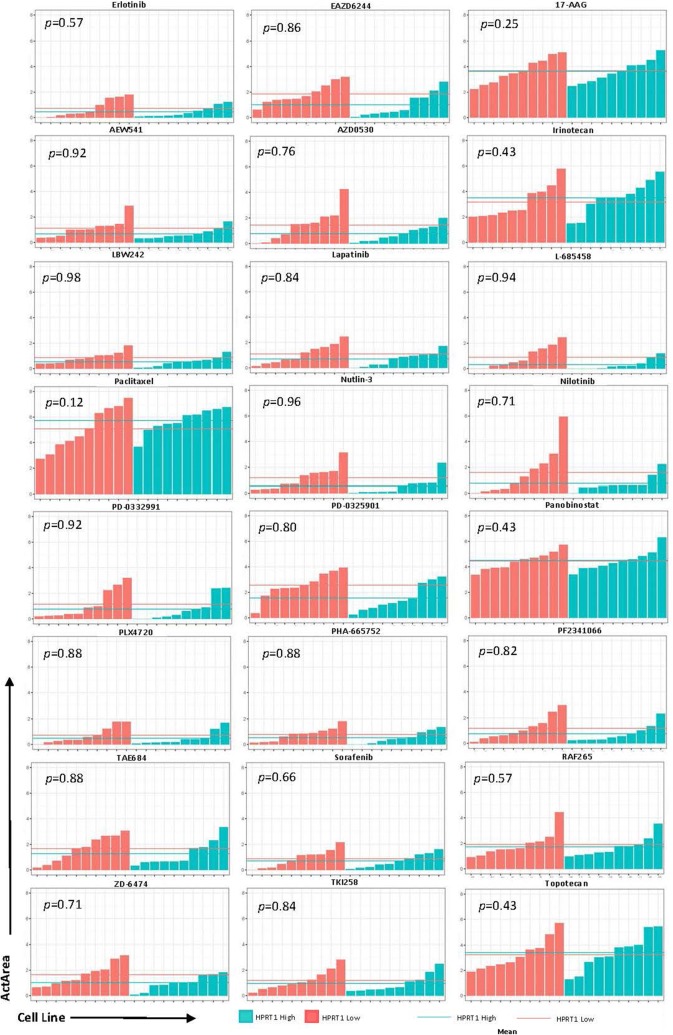
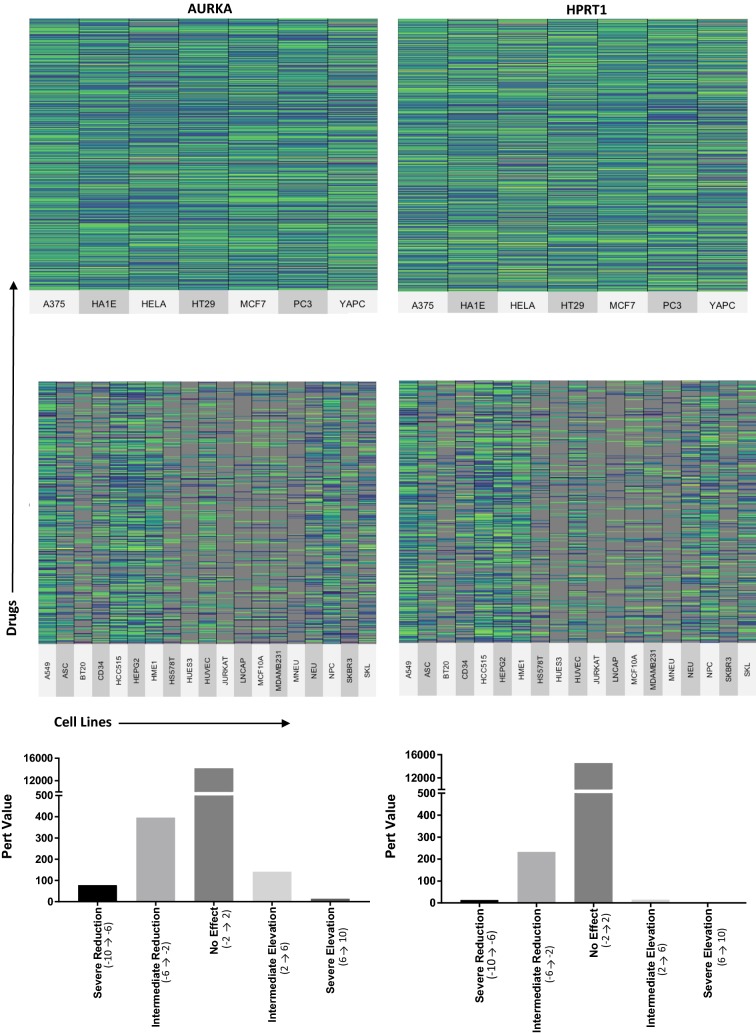
Methods: We evaluated 589 patients to determine differential expression between normal and malignant patient samples. We then supplemented these evaluations with immunohistochemistry staining of endometrial tumors and normal tissues. Additionally, we used the Library of Integrated Network-based Cellular Signatures to evaluate the effects of 1826 chemotherapy drugs on 26 cell lines to determine the effects of each drug on HPRT1 and AURKA expression.
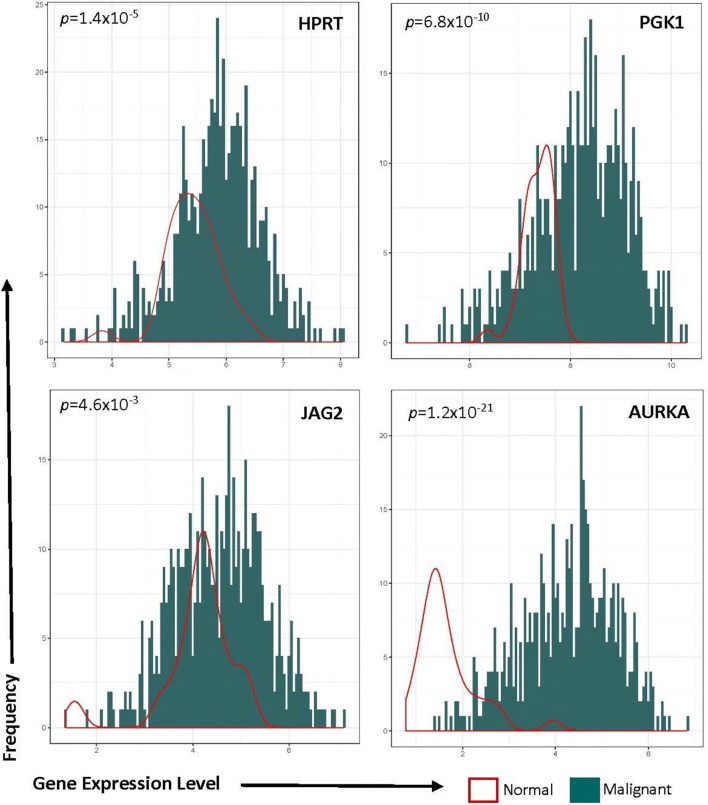
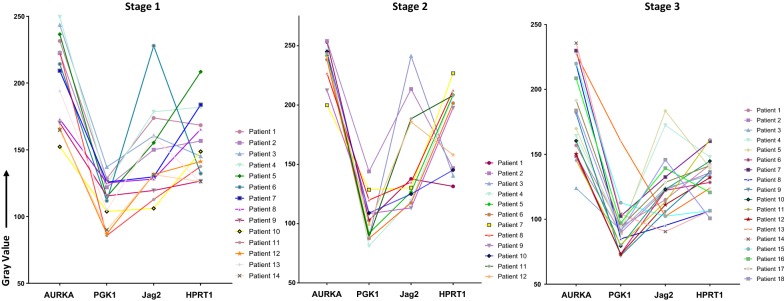
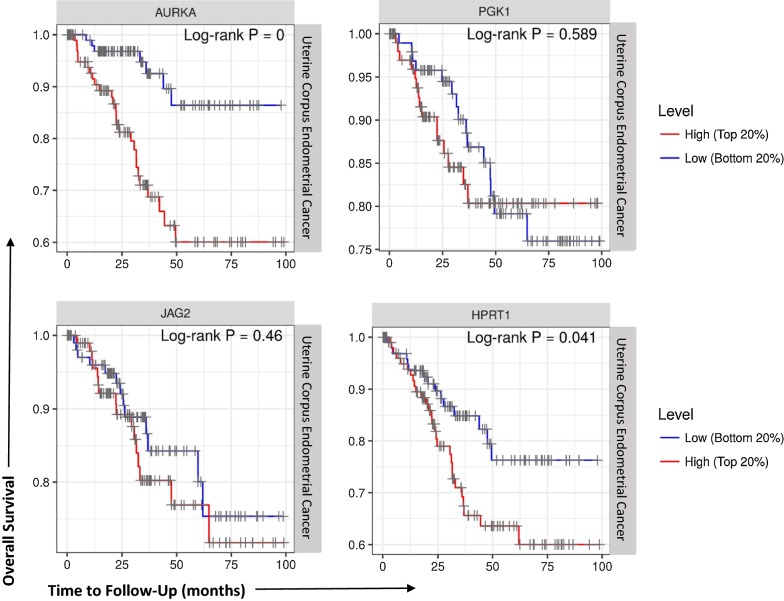
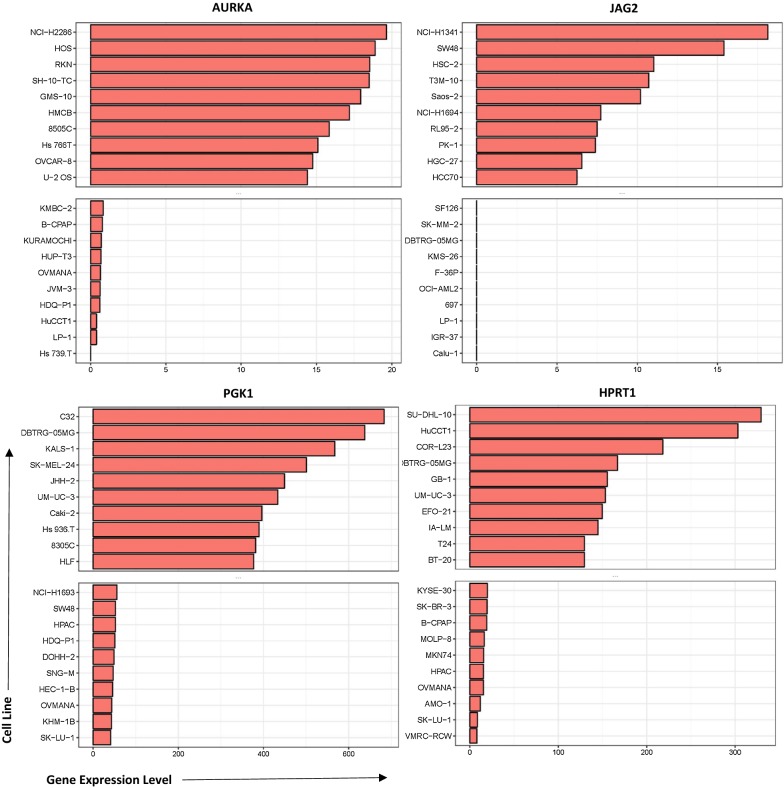
Results: Expression of HPRT1, Jag2, AURKA, and PGK1 were elevated when compared to normal samples, and HPRT1 and PGK1 showed a stepwise elevation in expression that was significantly related to cancer grade. To determine the prognostic potential of these genes, we evaluated patient outcome and found that levels of both HPRT1 and AURKA were significantly correlated with overall patient survival. When evaluating drugs that had the most significant effect on lowering the expression of HPRT1 and AURKA, we found that Topo I and MEK inhibitors were most effective at reducing HPRT1 expression. Meanwhile, drugs that were effective at reducing AURKA expression were more diverse (MEK, Topo I, MELK, HDAC, etc.). The effects of these drugs on the expression of HPRT1 and AURKA provides insight into their role within cellular maintenance.
Conclusions: Collectively, these data show that JAG2, AURKA, PGK1, and HRPT1 have the potential to be used independently as diagnostic, prognostic, or treatment biomarkers in endometrial cancer. Expression levels of these genes may provide physicians with insight into tumor aggressiveness and chemotherapy drugs that are well suited to individual patients.
Keywords: AURKA; Biomarkers; Endometrial cancer; HPRT1; JAG2; PGK1.
Figures
Similar articles
-
Aurora kinase A has a significant role as a therapeutic target and clinical biomarker in endometrial cancer.Int J Oncol. 2015 Apr;46(4):1498-506. doi: 10.3892/ijo.2015.2842. Epub 2015 Jan 22. Int J Oncol. 2015. PMID: 25625960 Free PMC article.
-
Integrated pan-cancer of AURKA expression and drug sensitivity analysis reveals increased expression of AURKA is responsible for drug resistance.Cancer Med. 2021 Sep;10(18):6428-6441. doi: 10.1002/cam4.4161. Epub 2021 Aug 1. Cancer Med. 2021. PMID: 34337875 Free PMC article.
-
Identification of optimal reference genes for gene expression normalization in a wide cohort of endometrioid endometrial carcinoma tissues.PLoS One. 2014 Dec 4;9(12):e113781. doi: 10.1371/journal.pone.0113781. eCollection 2014. PLoS One. 2014. PMID: 25473950 Free PMC article.
-
PGK1 facilities cisplatin chemoresistance by triggering HSP90/ERK pathway mediated DNA repair and methylation in endometrial endometrioid adenocarcinoma.Mol Med. 2019 Mar 29;25(1):11. doi: 10.1186/s10020-019-0079-0. Mol Med. 2019. PMID: 30925862 Free PMC article.
-
Endometrial neoplasia: prognostic significance of ploidy status.Clin Obstet Gynecol. 1996 Sep;39(3):696-706. doi: 10.1097/00003081-199609000-00017. Clin Obstet Gynecol. 1996. PMID: 8862893 Review.
Cited by
-
Overexpression of HPRT1 is associated with poor prognosis in head and neck squamous cell carcinoma.FEBS Open Bio. 2021 Sep;11(9):2525-2540. doi: 10.1002/2211-5463.13250. Epub 2021 Aug 4. FEBS Open Bio. 2021. PMID: 34231338 Free PMC article.
-
HPRT1: a preliminary investigation on its involvement in nasopharyngeal carcinoma.Discov Oncol. 2024 Nov 6;15(1):624. doi: 10.1007/s12672-024-01506-y. Discov Oncol. 2024. PMID: 39505752 Free PMC article.
-
Investigating the Role of Telomere and Telomerase Associated Genes and Proteins in Endometrial Cancer.Methods Protoc. 2020 Sep 3;3(3):63. doi: 10.3390/mps3030063. Methods Protoc. 2020. PMID: 32899298 Free PMC article.
-
Investigation of Transcriptome Patterns in Endometrial Cancers from Obese and Lean Women.Int J Mol Sci. 2022 Sep 29;23(19):11471. doi: 10.3390/ijms231911471. Int J Mol Sci. 2022. PMID: 36232772 Free PMC article.
-
KNL1 is a prognostic and diagnostic biomarker related to immune infiltration in patients with uterine corpus endometrial carcinoma.Front Oncol. 2023 Jan 27;13:1090779. doi: 10.3389/fonc.2023.1090779. eCollection 2023. Front Oncol. 2023. PMID: 36776306 Free PMC article.
References
-
- Kaaks R, Lukanova A, Kurzer MS. Obesity, endogenous hormones, and endometrial cancer risk. Cancer Epidemiol Prev Biomarkers. 2002;11:1531–1543. - PubMed
-
- Townsend MH, Felsted AM, Ence ZE, Piccolo SR, Robison RA, O’Neill KL. Elevated expression of hypoxanthine guanine phosphoribosyltransferase within malignant tissue. Cancer Clin Oncol. 2017;6:19. doi: 10.5539/cco.v6n2p19. - DOI
LinkOut - more resources
Full Text Sources
Research Materials
Miscellaneous
