

Accounting for preferential sampling in species distribution models
- PMID: 30680145
- PMCID: PMC6342115
- DOI: 10.1002/ece3.4789
Accounting for preferential sampling in species distribution models
Abstract
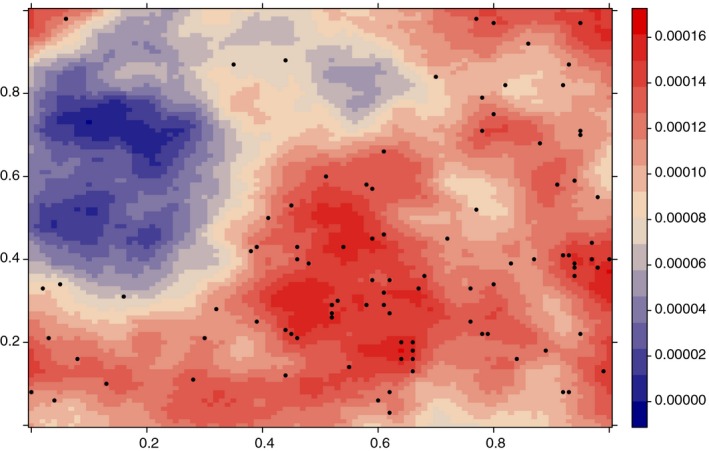
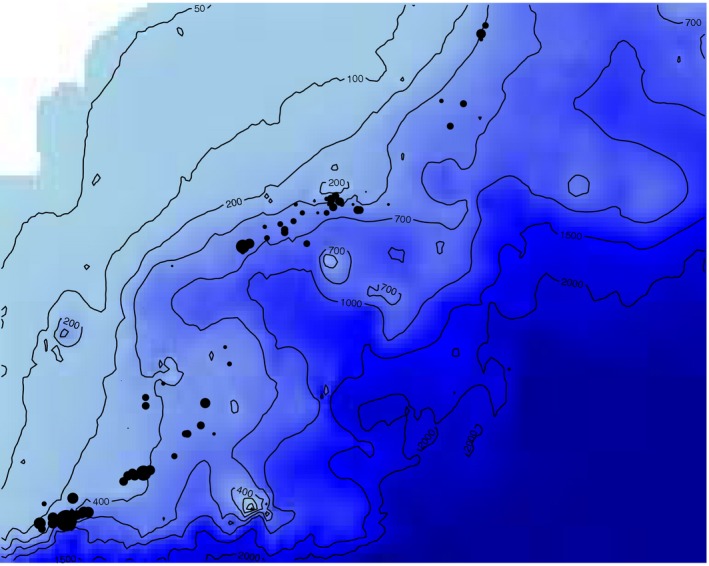
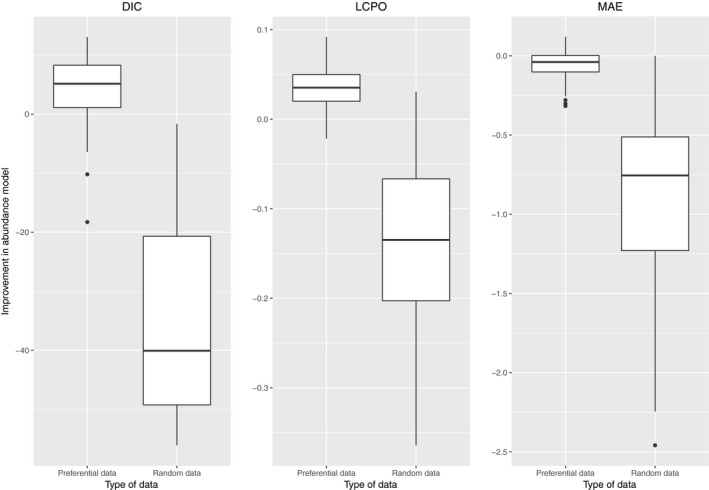
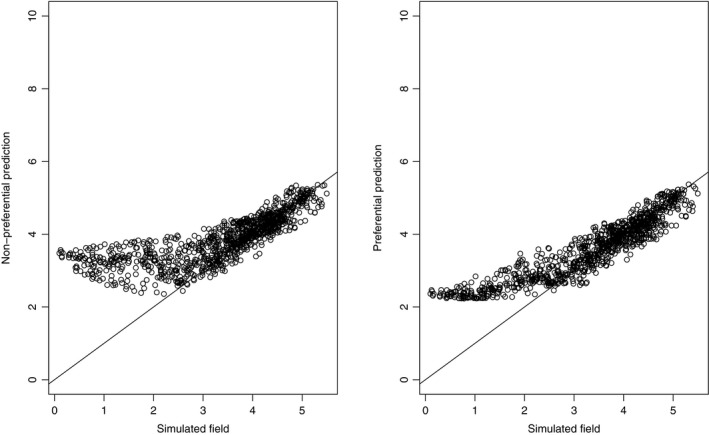
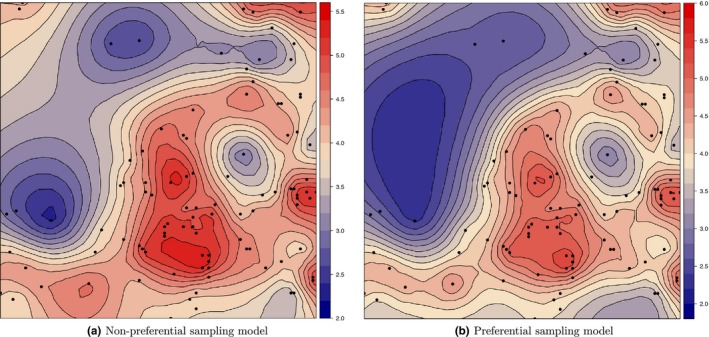
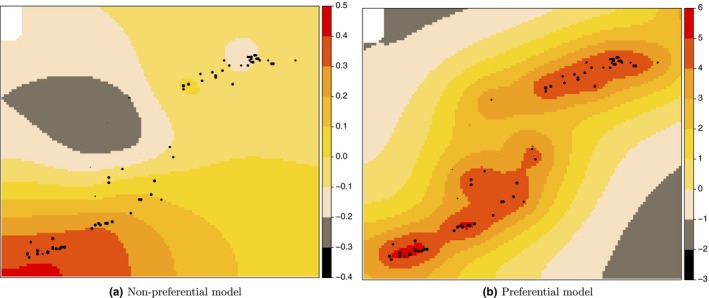
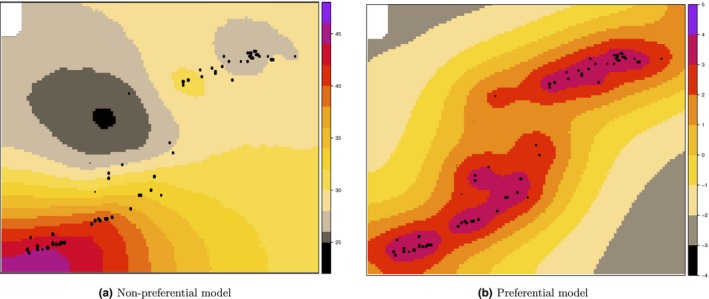
Species distribution models (SDMs) are now being widely used in ecology for management and conservation purposes across terrestrial, freshwater, and marine realms. The increasing interest in SDMs has drawn the attention of ecologists to spatial models and, in particular, to geostatistical models, which are used to associate observations of species occurrence or abundance with environmental covariates in a finite number of locations in order to predict where (and how much of) a species is likely to be present in unsampled locations. Standard geostatistical methodology assumes that the choice of sampling locations is independent of the values of the variable of interest. However, in natural environments, due to practical limitations related to time and financial constraints, this theoretical assumption is often violated. In fact, data commonly derive from opportunistic sampling (e.g., whale or bird watching), in which observers tend to look for a specific species in areas where they expect to find it. These are examples of what is referred to as preferential sampling, which can lead to biased predictions of the distribution of the species. The aim of this study is to discuss a SDM that addresses this problem and that it is more computationally efficient than existing MCMC methods. From a statistical point of view, we interpret the data as a marked point pattern, where the sampling locations form a point pattern and the measurements taken in those locations (i.e., species abundance or occurrence) are the associated marks. Inference and prediction of species distribution is performed using a Bayesian approach, and integrated nested Laplace approximation (INLA) methodology and software are used for model fitting to minimize the computational burden. We show that abundance is highly overestimated at low abundance locations when preferential sampling effects not accounted for, in both a simulated example and a practical application using fishery data. This highlights that ecologists should be aware of the potential bias resulting from preferential sampling and account for it in a model when a survey is based on non-randomized and/or non-systematic sampling.
Keywords: Bayesian modelling; integrated nested Laplace approximation; point processes; species distribution models; stochastic partial differential equation.
Figures
References
-
- Banerjee, S. , Carlin, B. P. , & Gelfand, A. E. (2004). Hierarchical modeling and analysis for spatial data. New York: Chapman and Hall/CRC.
-
- Brotons, L. , Herrando, S. , & Pla, M. (2007). Updating bird species distribution at large spatial scales: Applications of habitat modelling to data from long‐term monitoring programs. Diversity and Distributions, 13(3), 276–288. 10.1111/j.1472-4642.2007.00339.x - DOI
-
- Carbonell, A. , Llompart, P. J. , Gaza, M. , Mir, A. , Aparicio‐González, A. , Álvarez‐Barastegui, D. , … Cartes, J. E. (2017). Long‐term climatic influences on the physiological condition of the red shrimp Aristeus antennatus in the western Mediterranean Sea. Climate Research, 72(2), 111–127. 10.3354/cr01453 - DOI
-
- Conn, P. B. , Thorson, J. T. , & Johnson, D. S. (2017). Confronting preferential sampling when analysing population distributions: Diagnosis and model‐based triage. Methods in Ecology and Evolution, 8(11), 1535–1546. 10.1111/2041-210X.12803 - DOI
-
- Deval, M. C. , & Kapiris, K. (2016). A review of biological patterns of the blue‐red shrimp Aristeus antennatus in the Mediterranean Sea: A case study of the population of Antalya Bay, eastern Mediterranean sea. Scientia Marina, 80(3), 339–348. 10.3989/scimar.04411.22A - DOI
LinkOut - more resources
Full Text Sources
