. 2018 Dec 12;3(2):340-357.
doi: 10.1210/js.2018-00272. eCollection 2019 Feb 1.

Follicle-Stimulating Hormone Is an Autocrine Regulator of the Ovarian Cancer Metastatic Niche Through Notch Signaling

Affiliations

Follicle-Stimulating Hormone Is an Autocrine Regulator of the Ovarian Cancer Metastatic Niche Through Notch Signaling

Sakshi Gera et al. J Endocr Soc. .

Abstract

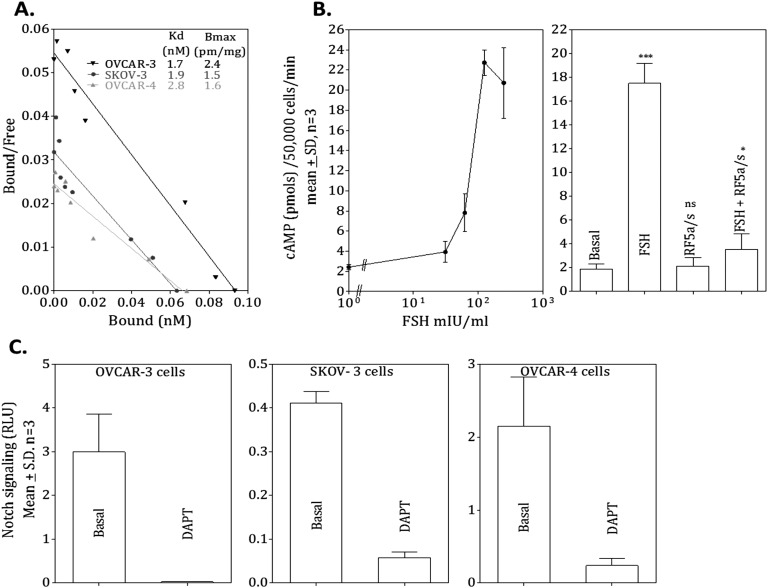
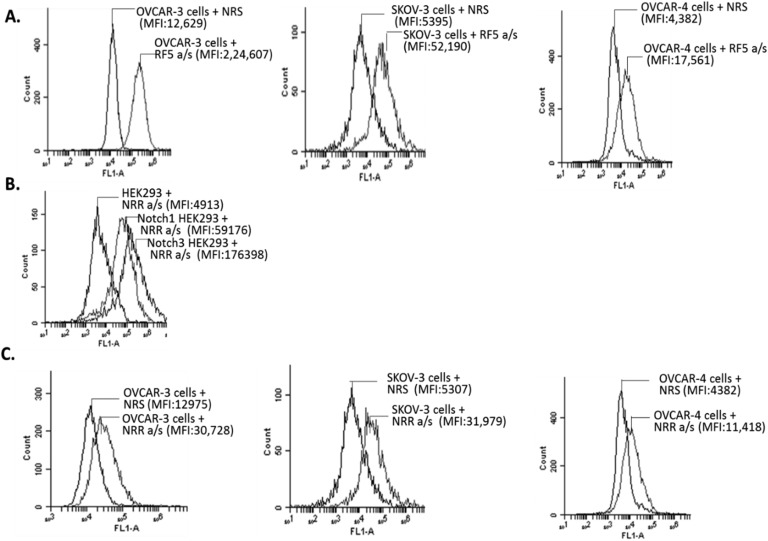
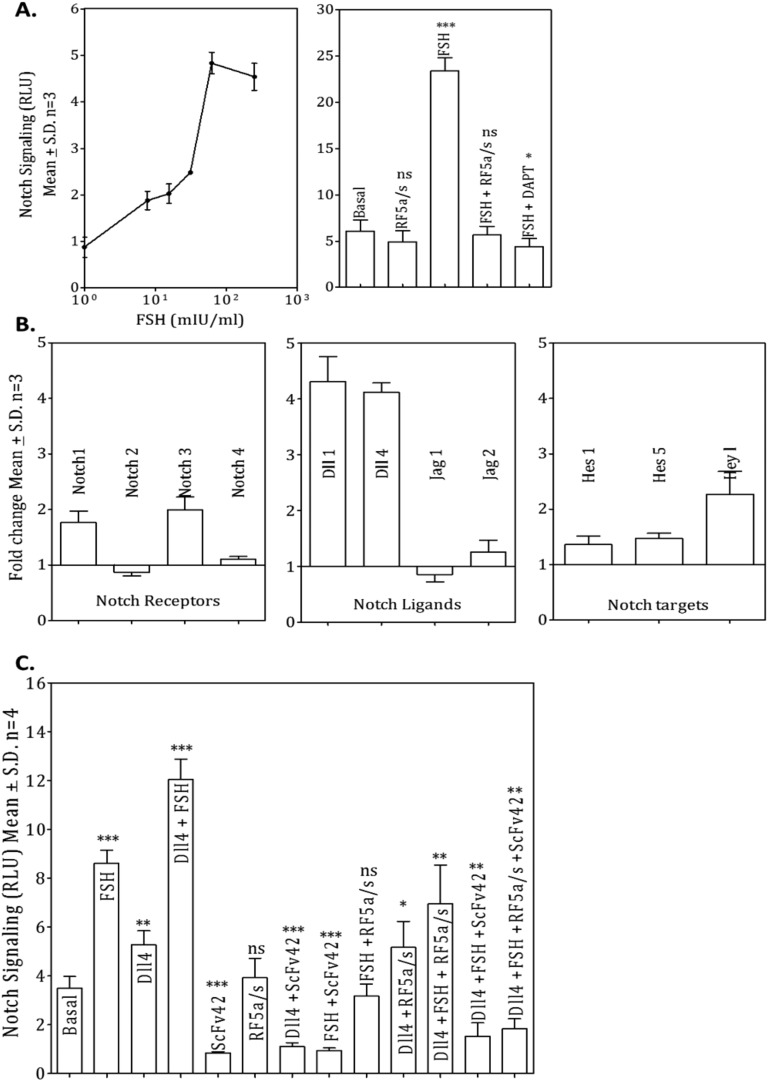
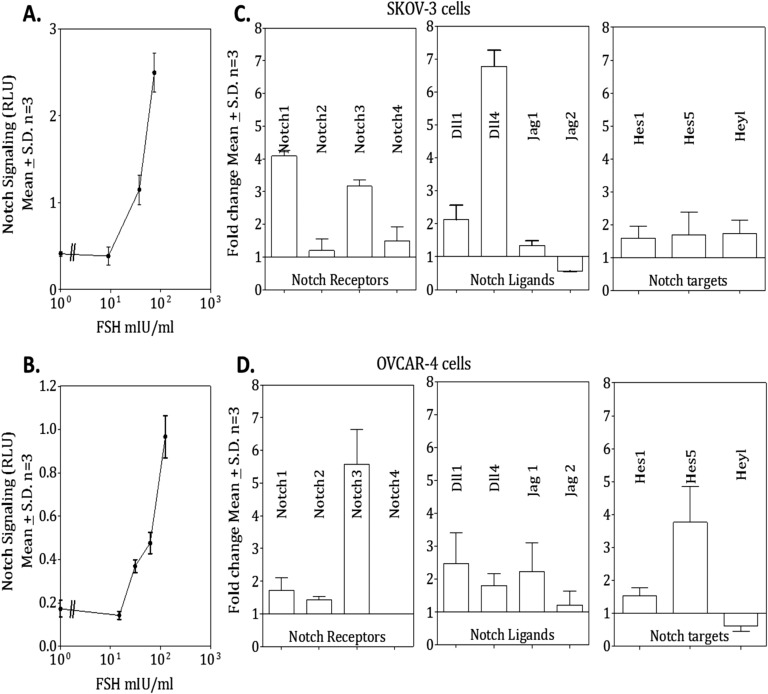
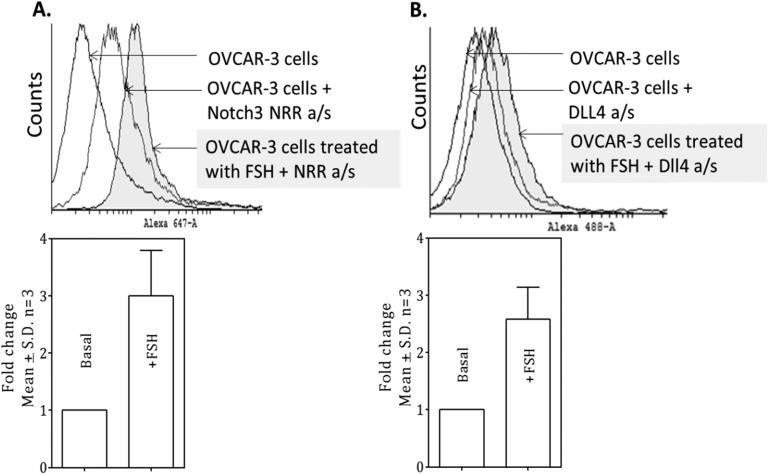
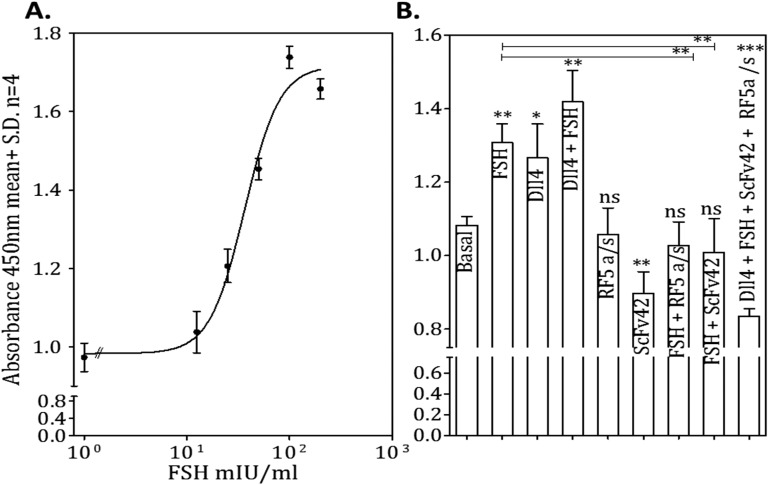
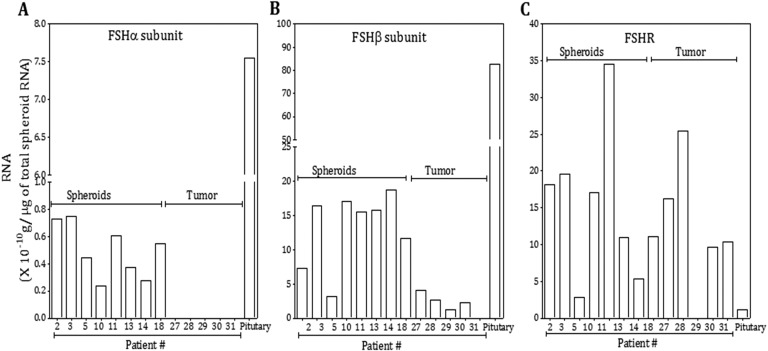
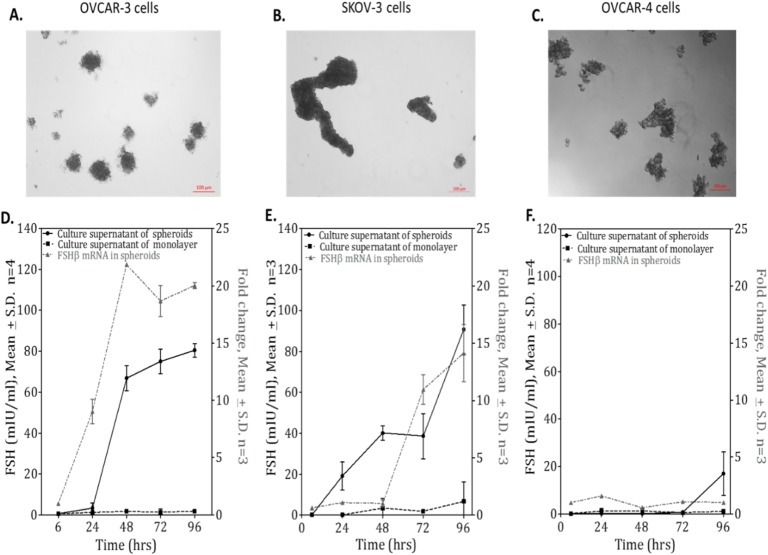
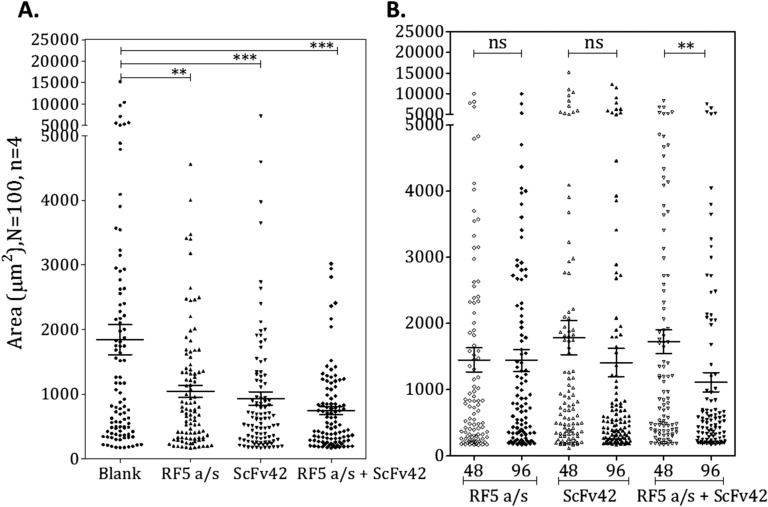
The association between the upregulated Notch and FSH signaling and ovarian cancer is well documented. However, their signaling has been investigated independently and only in the primary tumor tissues. The aim of this study was to investigate the interactive effects of FSH and Notch signaling on ovarian cancer proliferation, formation, and maintenance of disseminated ovarian cancer cells. The roles of Notch and FSH in ovarian cancer pathogenesis were investigated with ovarian cancer cell lines and specific antibodies against Notch and FSH receptor (FSHR). FSH upregulated Notch signaling and proliferation in ovarian cancer cells. High levels of FSH were detected in the ascites of patients with serous ovarian adenocarcinoma. Spheroids from the patients' ascites, as well as the spheroids from ovarian cancer cell lines under low attachment culture conditions, expressed FSHβ subunit mRNA and secreted the hormone into the medium. In contrast, primary ovarian tumor tissues and cell line monolayers expressed very low levels of FSHβ. Ovarian cancer cell spheroids also exhibited higher expression of FSH receptor and Notch downstream genes than their monolayer counterparts. A combination of FSHR and Notch antagonistic antibodies significantly inhibited spheroid formation and cell proliferation in vitro. This study demonstrates that spheroids in ascites express and secrete FSH, which regulates cancer cell proliferation and spheroidogenesis through Notch signaling, suggesting that FSH is an autocrine regulator of cancer metastasis. Furthermore, Notch and FSHR are potential immunotherapeutic targets for ovarian cancer treatment.


Figures

Figure 1.
Figure 1.
Characterization of FSH signaling in ovarian cancer cell lines. (A) The presence of FSHR on ovarian cancer cell lines OVCAR-3, SKOV-3, and OVCAR-4 was investigated by determining the binding of 125I-FSH to their membranes (10 μg each) in the presence of increasing concentrations of cold FSH. The binding data were converted to a Scatchard plot, and the inset table shows the Kd and Bmax of hormone in the three cell lines. (B) The activity of FSHR was investigated by analyzing the levels of cAMP in the presence of hormone by RIA. OVCAR-3 cells were incubated with increasing concentrations of FSH or with 100 mIU/mL FSH in the presence and absence of 5 µg/mL of RF5 a/s, and cAMP levels were determined. Significance was calculated by comparing the treated with basal values via nonparametric unpaired t test. (C) Ovarian cancer cells were transfected with 12XCSL luciferase reporter plasmid and incubated with 5 µM DAPT to determine Notch signaling activity. Reporter activity was analyzed after 24 h of incubation by dual luciferase assay. ns, P > 0.05; *P ≤ 0.05; ***P ≤ 0.001. Error bars represent mean ± SD, and n is the number of repeats. RLU, relative luciferase unit.
Figure 2.
Figure 2.
FSHR on ovarian cancer cell lines. (A) The presence of FSHR on ovarian cancer cell lines OVCAR-3, SKOV-3, and OVCAR-4 was analyzed by flow cytometry. The ovarian cancer cell lines were incubated with RF5 a/s (1:500 dilution) or normal rabbit a/s (NRS) and analyzed for binding with FITC-conjugated anti-rabbit secondary antibody. The histograms represent three independent experiments. (B) HEK293 cells and Notch1- and Notch3-overexpressing HEK293 cells were incubated with Notch3 NRR a/s (1:500 dilution) followed by anti-rabbit FITC, and binding was analyzed by flow cytometry. (C) The presence of Notch receptor on ovarian cancer cell lines OVCAR-3, SKOV-3, and OVCAR-4 was analyzed by flow cytometry. The ovarian cancer cell lines were incubated with Notch3 NRR a/s (1:500 dilution) or normal rabbit a/s (NRS) and analyzed for binding by anti-rabbit secondary antibody conjugated with FITC. The histograms represent three independent experiments. MFI, median fluorescent intensity.
Figure 3.
Figure 3.
Effect of FSH on Notch signaling. (A) OVCAR-3 cells were transfected with 12XCSL luciferase reporter plasmid and incubated with increasing concentrations of FSH or 100 mIU/mL of FSH in the presence of 5 µg/mL FSHR antagonist RF5 a/s and 5 µM DAPT in different combinations for 48 hours. Reporter activity was measured by dual luciferase assay after 48 h of incubation. (B) OVCAR-3 cells were incubated with 100 mIU/mL of FSH for 48 hours, and RT-PCR was performed for indicated Notch receptors, ligands, and target genes. The fold change in the expression of receptor and ligands was calculated with respect to cells cultured without hormone after normalizing with GAPDH expression. (C) OVCAR-3 cells transfected with 12XCSL luciferase reporter plasmid were cultured on precoated Dll4-Fc. 100 mIU/mL of FSH, 5 µg/mL FSHR antagonist RF5 a/s, and 10 µg/mL ScFv42 in different combinations were added to the cells for 48 h, and the effect on the Notch signaling was measured by dual luciferase assay. Significance is calculated by comparison of treated and basal values via nonparametric unpaired t test. ns, P > 0.05; *P ≤ 0.05; **P ≤ 0.01; ***P ≤ 0.001 compared with basal values. Error bars represent mean ± SD, and n is the number of repeats. RLU, relative luciferase unit.
Figure 4.
Figure 4.
Effect of FSH on Notch signaling. (A) SKOV-3 and (B) OVCAR-4 cells were transfected with 12XCSL luciferase reporter plasmid and incubated with increasing concentrations of FSH. The effect on the Notch signaling was measured by dual luciferase assay after 48 h. (C) SKOV-3 and (D) OVCAR-4 cells were incubated with 100 mIU/mL of FSH for 48 h, and RT-PCR was performed for indicated Notch receptors, ligands, and target genes. The fold change in the transcript levels of Notch genes was calculated with respect to the levels in cells cultured without hormone after normalizing with GAPDH expression. Error bars represent mean ± SD, and n is the number of repeats. RLU, relative luciferase unit.
Figure 5.
Figure 5.
Effect of FSH on Notch receptors and ligands. OVCAR-3 cells were harvested with EDTA after incubation with 100 mIU/mL of FSH for 48 hours and labeled with (A) Notch3 NRR a/s and (B) Dll4 antibody for analysis by flow cytometry. The antibody bound was determined by anti-rabbit Alexa 647 and anti-mouse Alexa 488, respectively. Binding of a/s was analyzed by comparing the median fluorescent intensity in the presence and absence of hormone. The histograms represent three independent experiments. Quantitative analysis of the same is represented in the bar graphs. Significance is calculated by comparison of treated and basal values via nonparametric unpaired t test. Error bars represent mean ± SD, and n is the number of repeats.
Figure 6.
Figure 6.
Effect of anti-Notch3 ScFv on Notch signaling. OVCAR-3 cells were transfected with luciferase plasmid and incubated with increasing concentrations of ScFv42 (Notch3 NRR antagonist) in the presence or absence of 100 mIU/mL FSH. Reporter activity was measured by dual luciferase assay after 48 h of incubation. n is the number of repeats. RLU, relative luciferase unit.
Figure 7.
Figure 7.
Effect of FSH on proliferation of ovarian cancer cells. (A) OVCAR-3 cells were synchronized by culturing in serum-free medium overnight and incubated with increasing FSH concentrations. The proliferation rate was investigated by analyzing the BrdU incorporation in the cells after 48 h. (B) OVCAR-3 cells [synchronized as in (A)] were cultured on precoated Dll4-Fc and incubated with 100 mIU/mL FSH, 5 µg/mL FSHR antagonist RF5 a/s, or 10 µg/mL ScFv42, in different combinations, for 48 h. Proliferation rate was investigated by BrdU incorporation, and significance was calculated by unpaired t test compared with the basal levels. ns, P > 0.05; *P ≤ 0.05; **P ≤ 0.01; ***P ≤ 0.001 compared with basal values. n is the number of repeats. Error bars represent mean ± SD.
Figure 8.
Figure 8.
Expression of FSH and FSHR in primary tumor and spheroids obtained from patients with ovarian cancer. Total RNA was isolated from the primary tumors and spheroids obtained from the ascites of patients with ovarian cancer, and cDNA was prepared from 1 µg total RNA. Cycle threshold values of (A) FSHα subunit, (B) FSHβ subunit, and (C) FSHR were examined by RT-PCR, and RNA levels were interpolated from the dilution curves of the respective genes.
Figure 9.
Figure 9.
Expression of FSH in ovarian cancer cell line spheroids. Photomicrographic images of cellular aggregates of (A) OVCAR-3, (B) SKOV-3, and (C) OVCAR-4 cells cultured in low-attachment conditions. (D) OVCAR-3, (E) SKOV-3, and (F) OVCAR-4 cultured in low-attachment conditions or as monolayers. FSH levels in the conditioned media of aggregates/spheroids or monolayers cultured for different time periods were analyzed by RIA. RT-PCR was performed to assay the transcript levels of FSHβ in cellular aggregates. Fold change was calculated with respect to cells cultured as monolayers after normalizing with GAPDH expression. Significance was calculated by comparison of treated and basal values via nonparametric unpaired t test. n is the number of repeats. Error bars represent mean ± SD.
Figure 10.
Figure 10.
Status of Notch and FSH signaling genes in OVCAR-3 spheroids. OVCAR-3 cells were cultured in low-attachment conditions or as monolayers and harvested after 48 h. RT-PCR was performed to assay the transcript levels of indicated (A) Notch receptors, ligands, targets, and (B) FSHR and FSHα subunit. The fold change in the expression level of genes was calculated with respect to OVCAR-3 cells cultured as monolayers after normalizing with GAPDH expression. Error bars represent mean ± SD, and n is the number of repeats.
Figure 11.
Figure 11.
Effects of FSH and Notch antagonist (RF5 a/s and ScFv42, respectively) on the aggregation of OVCAR-3 spheroids. (A) OVCAR-3 cells were cultured in low-attachment conditions in the presence of RF5 a/s (5 µg/mL) and ScFv42 (10 µg/mL) individually and in combination for 48 h, and images were taken (5 fields per well) before and after the treatment. The area of the spheroids in each image was analyzed in MATLAB. The distribution of area of the 100 OVCAR-3 spheroids cultured in the presence and absence of antagonists is plotted. Each symbol represents the area of a single spheroid. (B) OVCAR-3 spheroids cultured for 48 h were incubated with RF5 a/s (5 µg/mL), ScFv42 (10 µg/mL), or both, and the microscopic images were taken at regular intervals as above. The area of the spheroids in each image was analyzed in MATLAB. Distribution of area of the 100 spheroids was measured at 48 h (before the addition of antagonists) and at 96 h (i.e., 2 d after addition). Each symbol represents one spheroid, and the solid symbols represent the spheroids incubated with different antagonists. Significance was calculated by comparison of treated and basal values via ANOVA. Error bars represent mean ± SEM, n represents the number of repeats, and N is the number of spheroids analyzed. ns, P > 0.05; *P ≤ 0.05; **P ≤ 0.01; ***P ≤ 0.001 compared with nontreated.

References

    1. Jemal A, Bray F, Center MM, Ferlay J, Ward E, Forman D. Global cancer statistics. CA Cancer J Clin. 2011;61(2):69–90. - PubMed
    1. Choi J-H, Wong AS, Huang H-F, Leung PC. Gonadotropins and ovarian cancer. Endocr Rev. 2007;28(4):440–461. - PubMed
    1. Gwinn ML, Lee NC, Rhodes PH, Layde PM, Rubin GL. Pregnancy, breast feeding, and oral contraceptives and the risk of epithelial ovarian cancer. J Clin Epidemiol. 1990;43(6):559–568. - PubMed
    1. Havrilesky LJ, Moorman PG, Lowery WJ, Gierisch JM, Coeytaux RR, Urrutia RP, Dinan M, McBroom AJ, Hasselblad V, Sanders GD, Myers ER. Oral contraceptive pills as primary prevention for ovarian cancer: a systematic review and meta-analysis. Obstet Gynecol. 2013;122(1):139–147. - PubMed
    1. Ryle M. Gonadotropins and ovarian function. Acta Eur Fertil. 1973;4(3):113–122. - PubMed

LinkOut - more resources