. 2019 Mar;31(12):e1806788.
doi: 10.1002/adma.201806788. Epub 2019 Jan 24.

Porous Silicon Nanoneedles Modulate Endocytosis to Deliver Biological Payloads

Affiliations

Porous Silicon Nanoneedles Modulate Endocytosis to Deliver Biological Payloads

Sahana Gopal et al. Adv Mater. 2019 Mar.

Abstract

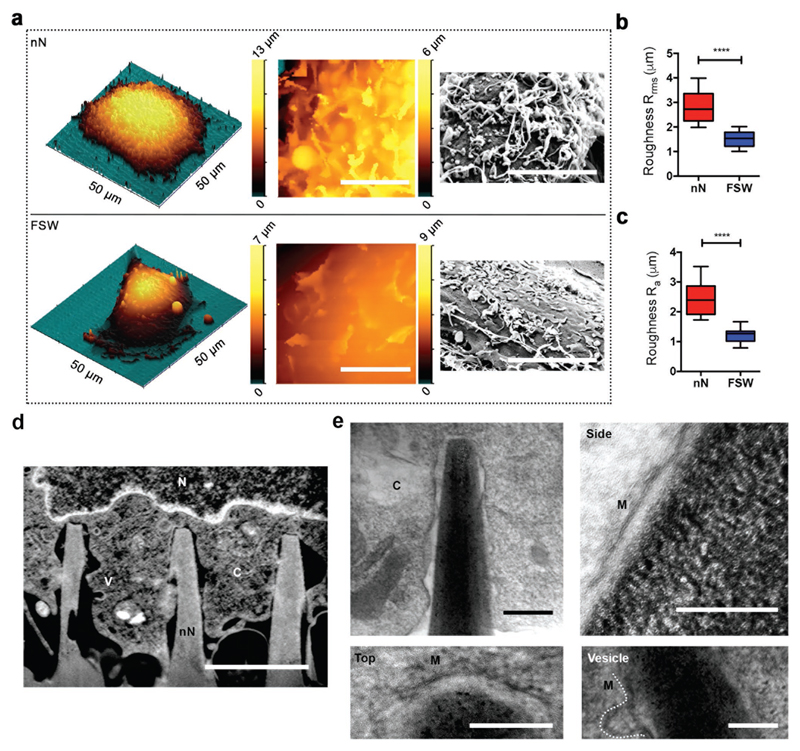
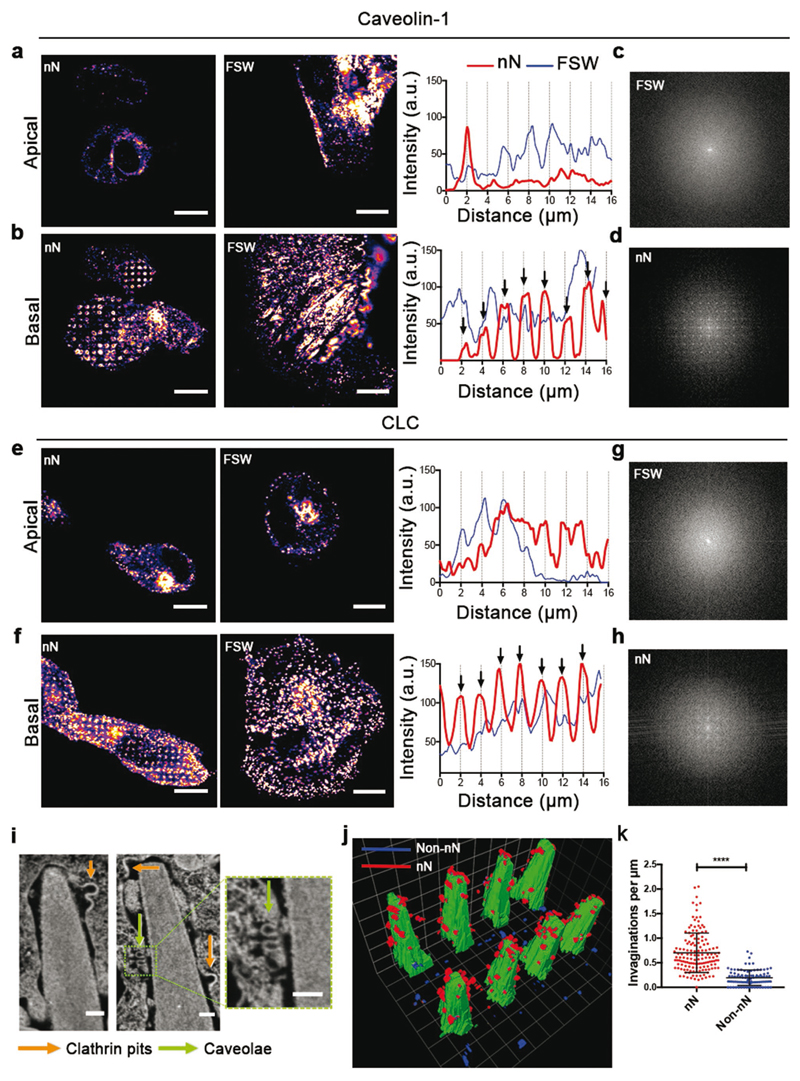
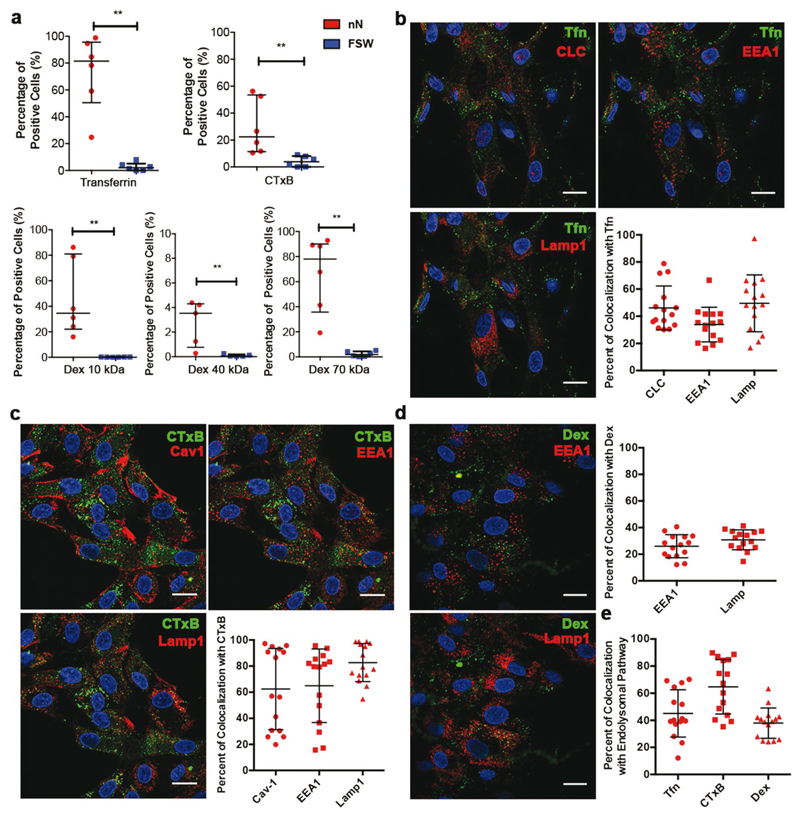
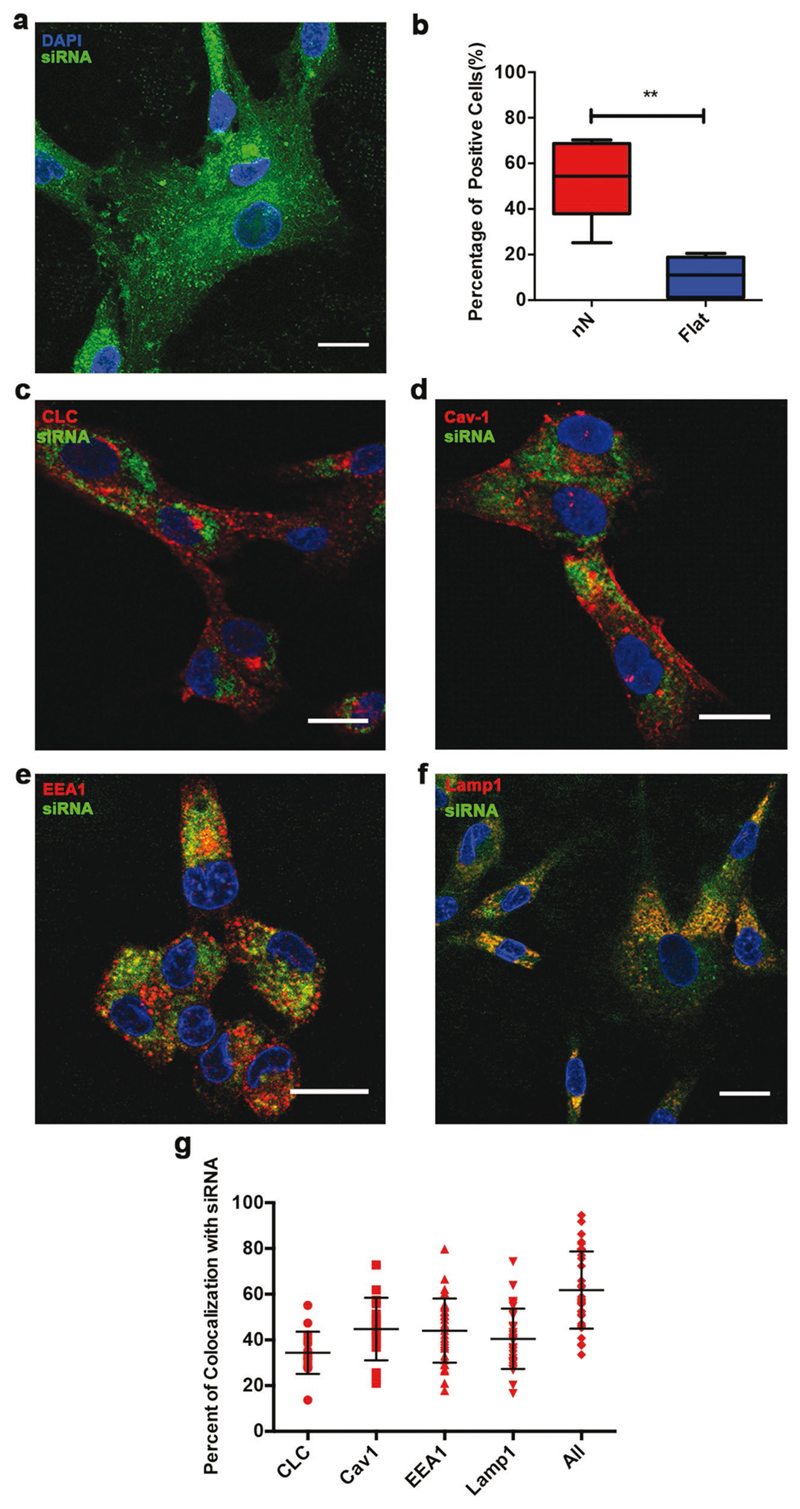
Owing to their ability to efficiently deliver biological cargo and sense the intracellular milieu, vertical arrays of high aspect ratio nanostructures, known as nanoneedles, are being developed as minimally invasive tools for cell manipulation. However, little is known of the mechanisms of cargo transfer across the cell membrane-nanoneedle interface. In particular, the contributions of membrane piercing, modulation of membrane permeability and endocytosis to cargo transfer remain largely unexplored. Here, combining state-of-the-art electron and scanning ion conductance microscopy with molecular biology techniques, it is shown that porous silicon nanoneedle arrays concurrently stimulate independent endocytic pathways which contribute to enhanced biomolecule delivery into human mesenchymal stem cells. Electron microscopy of the cell membrane at nanoneedle sites shows an intact lipid bilayer, accompanied by an accumulation of clathrin-coated pits and caveolae. Nanoneedles enhance the internalization of biomolecular markers of endocytosis, highlighting the concurrent activation of caveolae- and clathrin-mediated endocytosis, alongside macropinocytosis. These events contribute to the nanoneedle-mediated delivery (nanoinjection) of nucleic acids into human stem cells, which distribute across the cytosol and the endolysosomal system. This data extends the understanding of how nanoneedles modulate biological processes to mediate interaction with the intracellular space, providing indications for the rational design of improved cell-manipulation technologies.

Keywords: biointerface; drug delivery; endocytosis; nanoneedles; porous silicon.


Conflict of interest statement

Conflict of Interest

The authors declare no conflict of interest.

Figures

Figure 1
Figure 1. Cell membrane response to nanoneedle (nN) interfacing.
a) Nanoneedle interfacing induces membrane ruffling. 3D SICM image of an hMSC cultured on nanoneedles (top) or FSW (bottom) for 6 h (left). A zoomed-in 2D SICM scan (10 × 10 μm) (middle) and SEM image of the apical membrane (right). Scale bars = 5 μm. b,c) Nanoneedle interfacing increases membrane roughness. Surface roughness (b) Rrms and (c) Ra of apical membrane of hMSCs on nanoneedles compared to FSW measured by SICM. Box plot shows center line as median, first and third quartile data range, and whiskers to minimum and maximum. ****p < 0.0001 (two-tailed unpaired Student's t-test), n = 8 cells for nN and n = 11 cells for FSW. d,e) Cell membrane integrity is observed at the nanoneedle interface. C = cytosol, V = vesicle, N = nucleus, M = membrane. (d) Representative FIB-SEM image of an orthogonal cross section of an hMSC on nanoneedles after 6 h of interfacing. Scale bar = 2 μm. (e) TEM of FIB lift-out thin sections of the hMSC-nanoneedle interface. Clockwise: overview of a representative nanoneedle; nanoneedle side; vesicle located at the side of a nanoneedle; nanoneedle top. Scale bar = 200 nm.
Figure 2
Figure 2. Nanoneedles locally activate endocytosis.
a–d) Caveolin-1 (Cav-1) accumulates around nanoneedles. a,b) Confocal fluorescence images of caveolin-1 after 6 h in the (a) apical and (b) basal membrane of hMSCs cultured on nanoneedles or FSW and their respective line intensity profiles over the cells. Arrows in line intensity plots indicate 2 μm intervals matching the distance between individual nanoneedles. c,d) Upon interfacing, Cav-1 at the basal membrane acquires the same periodicity as the nanoneedles as assessed by Fourier transform analysis of the basal surface of hMSCs in panels (a) and (b). e,f) Clathrin accumulates around nanoneedles. Confocal fluorescence images of CLC after 6 h in the (e) apical and (f) basal membrane of hMSCs cultured on nanoneedles or FSW and their respective intensity profiles along the dashed lines. g,h) Upon interfacing, clathrin at the basal membrane acquires the same periodicity as nanoneedles as assessed by Fourier transform analysis of the basal surface of hMSCs in panels e and f. Scale bars = 10 μm. i–k) Endocytic vesicles accumulate around nanoneedles. (i) FIB-SEM image interface showing two classes of endocytic vesicles accumulating around nanoneedles: clathrin pits (orange arrows) and caveolae (green arrows). Scale bars = 100 nm. (j) 3D reconstruction of the cell-nanoneedle interface over two consecutive rows of nanoneedles highlighting vesicular structures present in the membrane at nanoneedle (red) and non-nanoneedle (blue) locations. (k) Quantification of vesicular invaginations in the membrane from FIB-SEM data at nanoneedle and non-nanoneedle locations. Plot shows mean ± S.D., N = 4, n = 11 (cells), ****p < 0.0001 (two-tailed unpaired Student's t-test).
Figure 3
Figure 3. Nanoinjection enhances the uptake of pathway-specific cargo, which localizes within the endolysosomal system.
a) Nanoinjection enhances uptake of Tfn, CTxB, and Dex of different sizes. Flow cytometry analysis showing the percentage of positive cells successfully internalizing pathway specific payloads by nanoinjection or FSW delivery at 24 h. Clockwise – Tfn, a clathrin-mediated endocytosis cargo, CTxB, a caveolae-specific cargo, and Dex 10, 40, 70 kDa, Macropinocytosis-specific cargo. Data presented as median with interquartile range. N = 3, n = 2 **p = 0.0022 for Tfn, CTxB, Dex 10, Dex 70 kDa and **p = 0.0079 for Dex 40 kDa (Mann–Whitney test). b) Tfn fate. Representative confocal images of a plane above the nanoneedles and quantification of Tfn (green) colocalization with CLC, EEA1 and LAMP1 at 24 h. c) Cholera Toxin fate. Representative confocal images of a plane above the nanoneedles and quantification of CTxB colocalization with Cav-1, EEA1 and LAMP1 at 24 h. d) Dex fate. Representative confocal images of a plane above the nanoneedles and quantification of Dex 10 kDa colocalization with EEA1 and LAMP1 at 24 h. Quantified data represented scatter dot plots with bars representing mean ± S.D., N = 1, n = 3 biological replicates, at least five images per n. Scale bars = 20 μm. e) Quantification of Tfn, CTxB and Dex 10 kDa localization with their pathway-specific endocytosis carriers and trafficking components (Tfn with CLC, EEA1 and LAMP1, CTxB with Cav-1, EEA1 and LAMP1 and Dex10 with EEA1 and LAMP1). Quantified data presented as scatter dot plots with bars representing mean ± S.D., N = 1, n = 3 biological replicates, at least five images per n.
Figure 4
Figure 4. Nanoinjected siRNA partly localizes across the endolysosomes while retaining cytosolic activity.
a,b) Nanoinjection enhances siRNA delivery. (a) Maximal Z-stack projection of hMSCs above the nanoneedles showing fluorescently labeled Cy3-siRNA-GAPDH (green) in the cell after 24 h of interfacing. (b) Flow cytometry data of Cy3-siRNA uptake in hMSCs mediated by nanoneedles compared to FSW after 24 h. Box plot shows center line as median, first and third quartile data range, and whiskers to minimum and maximum. **p = 0.0022 (Mann–Whitney test), N = 4, n = 2. c–f) Representative confocal images of Cy3-siRNA colocalization with (c) CLC, (d) Cav-1, (e) EEA1, and (f) LAMP1. Scale bars = 20 μm. g) Colocalization of endocytic carrier proteins (CLC, Cav-1), endosomes (EEA1) and late endosomes/ lysosomes (LAMP1) and their combination (All) with Cy3-siRNA. Values reported as aligned scatter plot of percentages of Cy3-siRNA pixels overlapping with indicated components of the endolysosomal system (Mander's coefficient). Lines represent mean ± S.D. N = 3, n = 2 for LAMP1, EEA1, N = 3, n = 1 for CLC, Cav-1. —Five to ten images per sample.

References

    1. Stewart MP, Sharei A, Ding X, Sahay G, Langer R, Jensen KF. Nature. 2016;538:183. - PubMed
    1. Chiappini C. ACS Sens. 2017;2:1086. - PubMed
    1. McKnight TE, Melechko AV, Griffin GD, Guillorn MA, Merkulov VI, Serna F, Hensley DK, Doktycz MJ, Lowndes DH, Simpson ML. Nanotechnology. 2003;14:551.
    1. Kim W, Ng JK, Kunitake ME, Conklin BR, Yang P. J Am Chem Soc. 2007;129:7228. - PubMed
    1. Shalek AK, Robinson JT, Karp ES, Lee JS, Ahn D-R, Yoon M-H, Sutton A, Jorgolli M, Gertner RS, Gujral TS, MacBeath G, et al. Proc Natl Acad Sci U S A. 2010;107:1870. - PMC - PubMed

MeSH terms