. 2019 Mar 22;58(13):4179-4183.
doi: 10.1002/anie.201812759. Epub 2019 Feb 20.

Real-Time Interrogation of Aspirin Reactivity, Biochemistry, and Biodistribution by Hyperpolarized Magnetic Resonance Spectroscopy

Affiliations

Real-Time Interrogation of Aspirin Reactivity, Biochemistry, and Biodistribution by Hyperpolarized Magnetic Resonance Spectroscopy

Niki M Zacharias et al. Angew Chem Int Ed Engl. .

Abstract

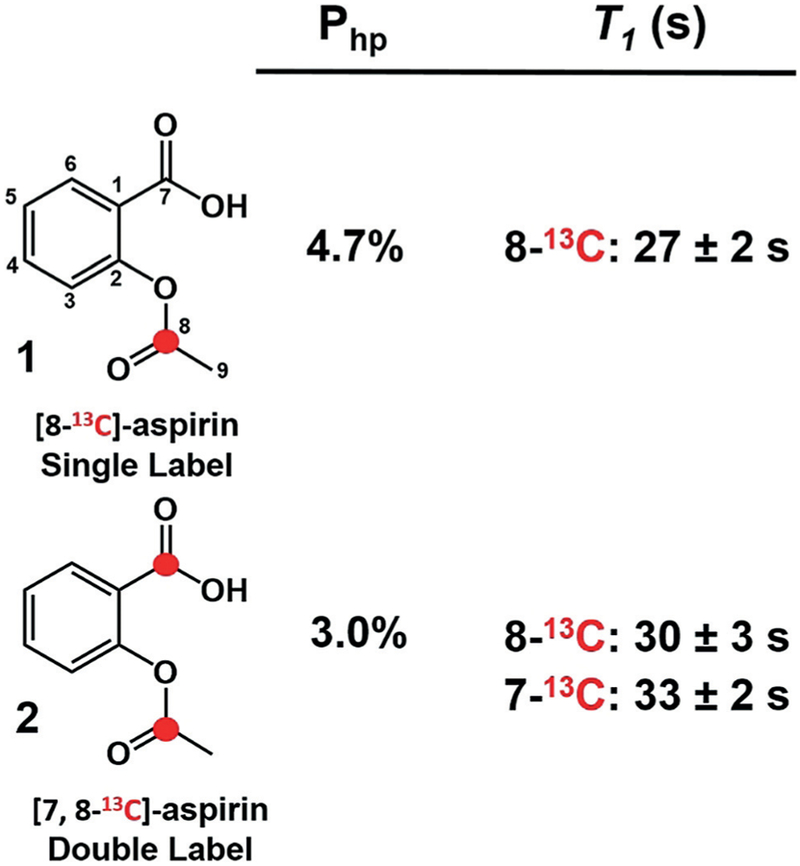
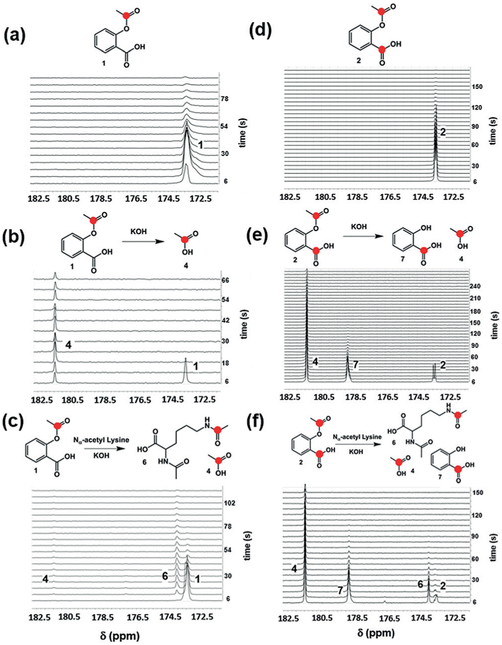
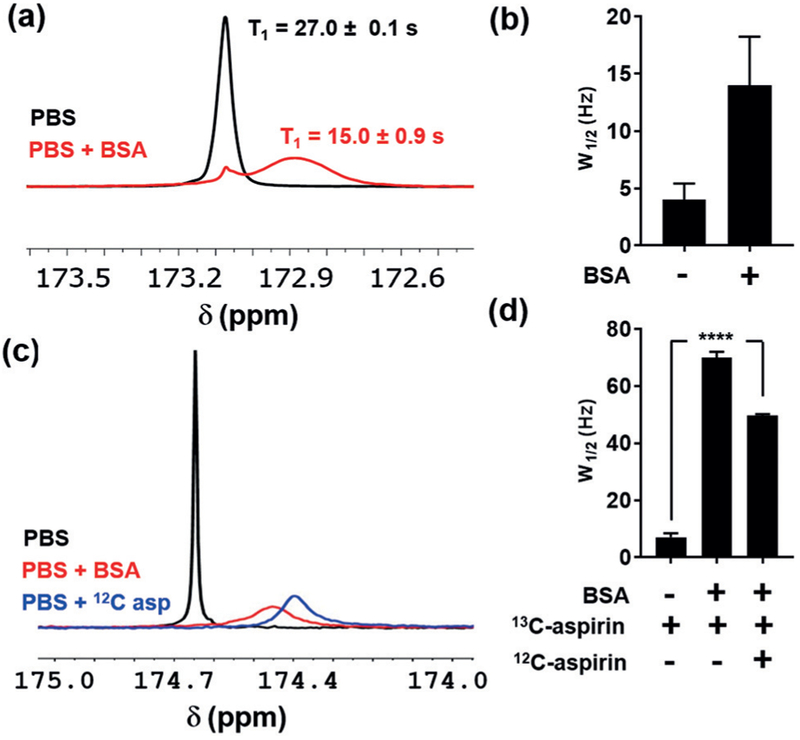
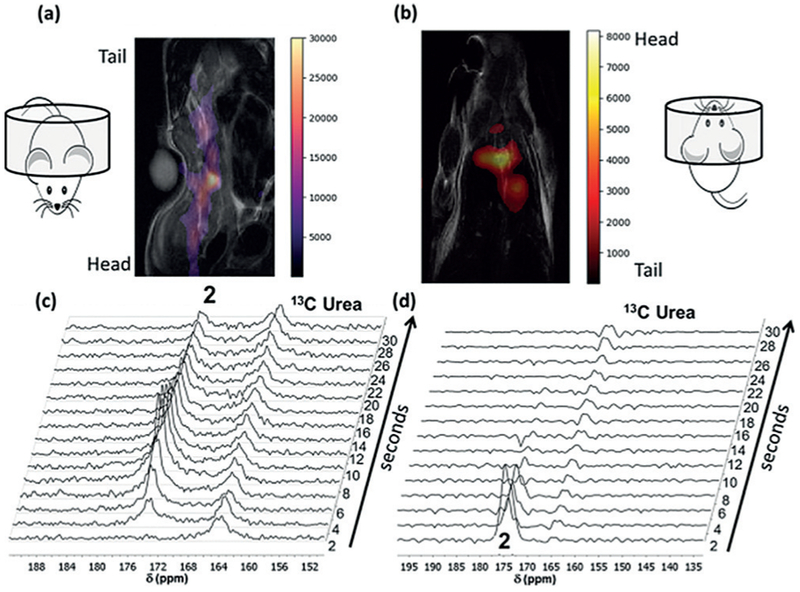
Hyperpolarized magnetic resonance spectroscopy enables quantitative, non-radioactive, real-time measurement of imaging probe biodistribution and metabolism in vivo. Here, we investigate and report on the development and characterization of hyperpolarized acetylsalicylic acid (aspirin) and its use as a nuclear magnetic resonance (NMR) probe. Aspirin derivatives were synthesized with single- and double-13 C labels and hyperpolarized by dynamic nuclear polarization with 4.7 % and 3 % polarization, respectively. The longitudinal relaxation constants (T1 ) for the labeled acetyl and carboxyl carbonyls were approximately 30 seconds, supporting in vivo imaging and spectroscopy applications. In vitro hydrolysis, transacetylation, and albumin binding of hyperpolarized aspirin were readily monitored in real time by 13 C-NMR spectroscopy. Hyperpolarized, double-labeled aspirin was well tolerated in mice and could be observed by both 13 C-MR imaging and 13 C-NMR spectroscopy in vivo.

Keywords: aspirin; chemopreventive; hyperpolarization; magnetic resonance imaging; magnetic resonance spectroscopy.


Conflict of interest statement

Conflict of interest

The authors declare no conflict of interest.

Figures

Figure 1.
Figure 1.
13C-labeled acetylsalicylic acid (aspirin) derivatives synthesized in this study. 13C-labeled carbons are represented by a red dot. The carbon numbering scheme used throughout this manuscript is shown. Percent polarization values (Php) and median longitudinal relaxation constants (T1) for single-labeled (n = 2) and double-labeled (n = 2) aspirin at 7 T are provided ± standard error of the mean.
Figure 2.
Figure 2.
In vitro reactions with hyperpolarized 1 and 2. a) Hyperpolarized 1 in phosphate-buffered saline (PBS, 100% D2O, 7 T). b) Hyperpolarized 1 in 1 m KOH hydrolyzes rapidly to form hyperpolarized acetate 4, seen at 181.5 ppm. c) Hyperpolarized 1 in 1 m KOH and 250 mM Nα-acetyl lysine undergoes rapid transacetylation to form Nα, 13C-Nε-diacetyl lysine 6, seen at 174.1 ppm. d) Hyperpolarized 2 in PBS (100% D2O). Both 13C-labeled carbons were observed as a partially resolved doublet at 173.3–173.6 ppm (7 T). e) Hydrolysis of hyperpolarized 2 in excess KOH resulted in the formation of 13C-acetate 4 and 13C-salicylic acid 7 (178.7 ppm). f) Reaction with hyperpolarized 2 and Nα-acetyl lysine showed the expected Nα, 13C-Nε-diacetyl lysine 6 as well as 13C-acetate and 13C-salicylic acid.
Figure 3.
Figure 3.
Interaction between hyperpolarized 1 and bovine serum albumin (BSA). a) Stacked 13C-NMR spectra of hyperpolarized 1 in phosphate-buffered saline (PBS, 10% D2O) and 50 mgmL−1 BSA in PBS (10% D2O). Median T1 values for the major resonances in each spectrum are shown±standard deviation (n = 2). b) Average linewidths of the major peaks (W1/2 in Hz) in each hyperpolarized spectrum are shown along with the standard deviation (n = 2). c) Stacked non-hyperpolarized 13C-NMR spectra of 1 in PBS, PBS+BSA, and PBS+BSA with 3-fold excess 12C-aspirin (1000 scans per spectrum). d) Median linewidths of the major aspirin resonance in each spectrum along with the standard deviation (n = 4). Two-way analysis of variance (ANOVA, multiple comparisons) was used to assess statistical significance (****, P<0.0001).
Figure 4.
Figure 4.
In vivo imaging and spectroscopy of hyperpolarized double-labeled aspirin 2. a) Overlaid 1H and 13C (false color) coronal image immediately after injection of hyperpolarized 2. The posterior of the mouse was placed inside the volume coil. b) Same as (a) except the anterior of the mouse occupies the volume coil and imaging was initiated 5 seconds after injection. Single 13C transient arrays following injection of hyperpolarized 2 with the posterior (c) or the anterior (d) of the mouse placed in the volume coil. The resonance for 2 is readily observed at 174.5 ppm for approximately 30 seconds when spectroscopy is initiated immediately after injection (c).

References

    1. a)Algra AM, Rothwell PM, Lancet Oncol. 2012, 13, 518–527; - PubMed
    2. b)Chan AT, Ogino S, Fuchs CS, JAMA J. Am. Med. Assoc 2009, 302, 649–658. - PMC - PubMed
    1. Wang D, Dubois RN, Oncogene 2010, 29, 781–788. - PMC - PubMed
    1. Ornelas A, Zacharias-Millward N, Menter DG, Davis JS, Lichtenberger L, Hawke D, Hawk E, Vilar E, Bhattacharya P, Millward S, Cancer Metastasis Rev. 2017, 36, 289–303. - PMC - PubMed
    1. Bhatt DL, Grosser T, Dong JF, Logan D, Jeske W, Angiolillo DJ, Frelinger AL 3rd, Lei L, Liang J, Moore JE, Cryer B, Marathi U, J. Am. Coll. Cardiol 2017, 69, 603–612. - PubMed
    1. Chan AT, Tranah GJ, Giovannucci EL, Hunter DJ, Fuchs CS, J. Natl. Cancer Inst 2005, 97, 457–460. - PubMed

Publication types

LinkOut - more resources