

Does In Vitro Cytochrome P450 Downregulation Translate to In Vivo Drug-Drug Interactions? Preclinical and Clinical Studies With 13-cis-Retinoic Acid
- PMID: 30681285
- PMCID: PMC6617839
- DOI: 10.1111/cts.12616
Does In Vitro Cytochrome P450 Downregulation Translate to In Vivo Drug-Drug Interactions? Preclinical and Clinical Studies With 13-cis-Retinoic Acid
Abstract
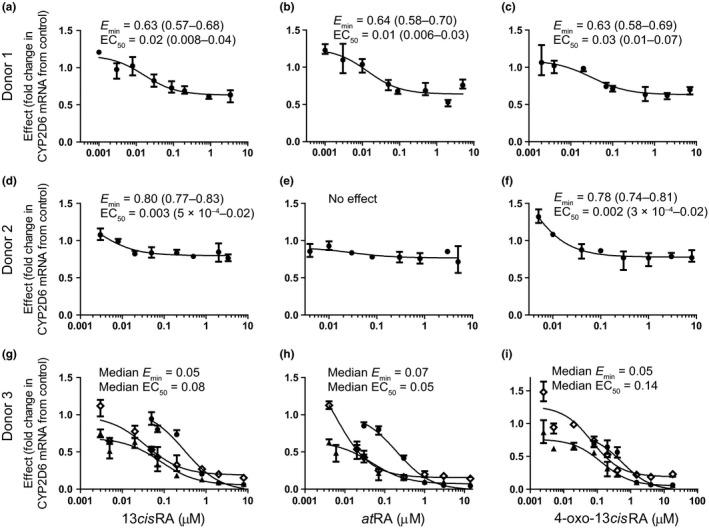
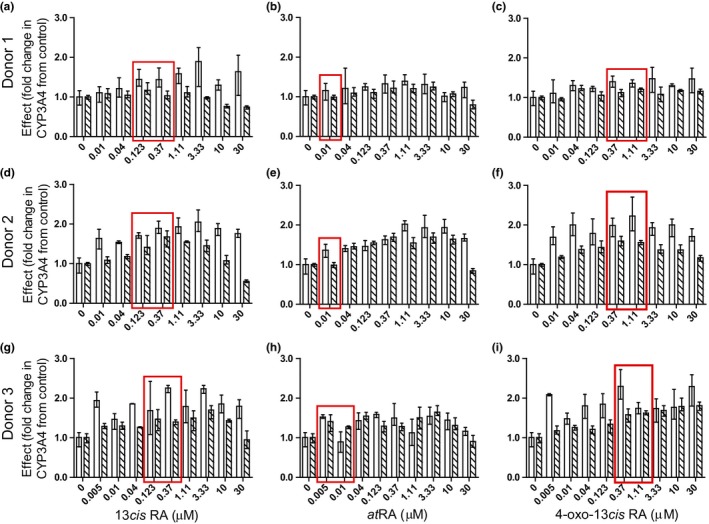
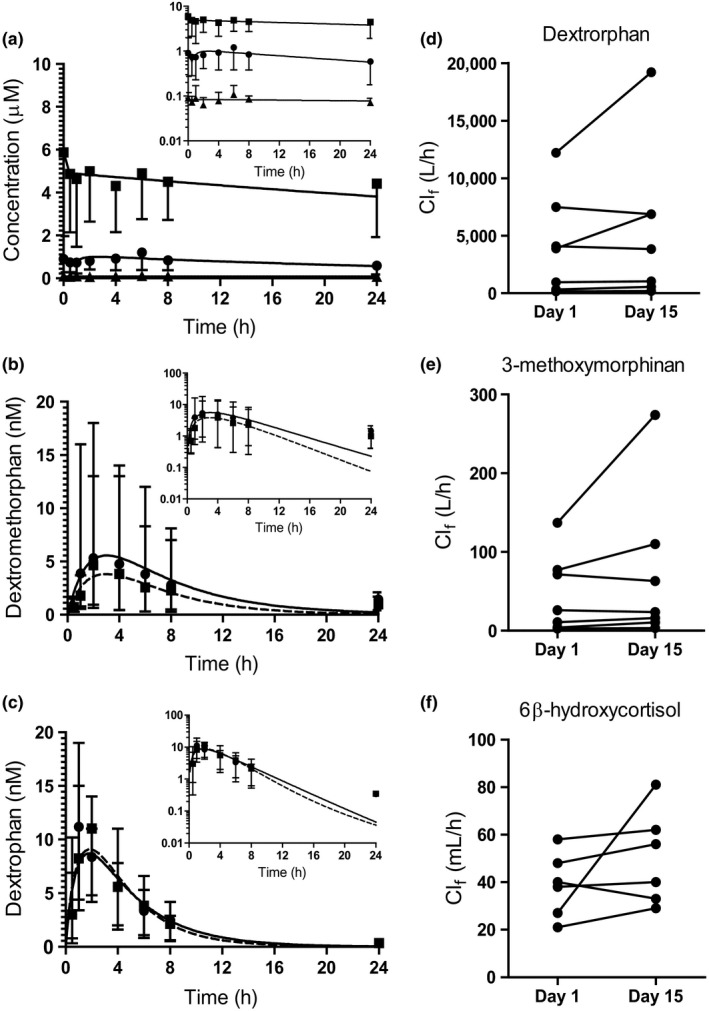
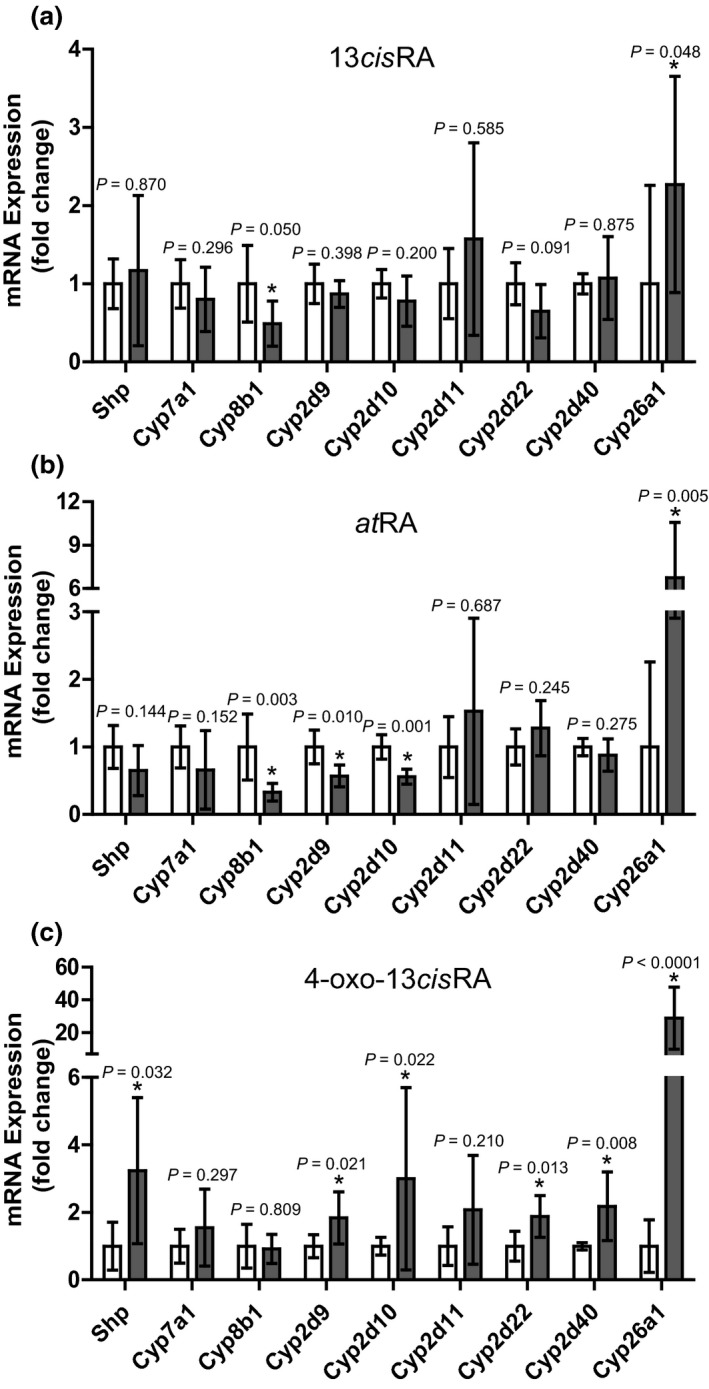
All-trans-retinoic acid (atRA) downregulates cytochrome P450 (CYP)2D6 in several model systems. The aim of this study was to determine whether all active retinoids downregulate CYP2D6 and whether in vitro downregulation translates to in vivo drug-drug interactions (DDIs). The retinoids atRA, 13cisRA, and 4-oxo-13cisRA all decreased CYP2D6 mRNA in human hepatocytes in a concentration-dependent manner. The in vitro data predicted ~ 50% decrease in CYP2D6 activity in humans after dosing with 13cisRA. However, the geometric mean area under plasma concentration-time curve (AUC) ratio for dextromethorphan between treatment and control was 0.822, indicating a weak induction of dextromethorphan clearance following 13cisRA treatment. Similarly, in mice treatment with 4-oxo-13cisRA-induced mRNA expression of multiple mouse Cyp2d genes. In comparison, a weak induction of CYP3A4 in human hepatocytes translated to a weak in vivo induction of CYP3A4. These data suggest that in vitro CYP downregulation may not translate to in vivo DDIs, and better understanding of the mechanisms of CYP downregulation is needed.
© 2019 The Authors. Clinical and Translational Science published by Wiley Periodicals, Inc. on behalf of the American Society for Clinical Pharmacology and Therapeutics.
Conflict of interest statement
As an Associate Editor for
Figures
Similar articles
-
Effect of isotretinoin on CYP2D6 and CYP3A activity in patients with severe acne.Br J Clin Pharmacol. 2024 Mar;90(3):759-768. doi: 10.1111/bcp.15938. Epub 2023 Nov 21. Br J Clin Pharmacol. 2024. PMID: 37864393 Free PMC article.
-
Isotretinoin and its Metabolites Alter mRNA of Multiple Enzyme and Transporter Genes In Vitro, but Downregulation of Organic Anion Transporting Polypeptide Does Not Translate to the Clinic.Drug Metab Dispos. 2022 Jul;50(7):1042-1052. doi: 10.1124/dmd.122.000882. Epub 2022 May 11. Drug Metab Dispos. 2022. PMID: 35545255 Free PMC article.
-
Molecular targeting of retinoic acid metabolism in neuroblastoma: the role of the CYP26 inhibitor R116010 in vitro and in vivo.Br J Cancer. 2007 Jun 4;96(11):1675-83. doi: 10.1038/sj.bjc.6603779. Epub 2007 May 8. Br J Cancer. 2007. PMID: 17486130 Free PMC article.
-
Hepatic Cyp2d and Cyp26a1 mRNAs and activities are increased during mouse pregnancy.Drug Metab Dispos. 2013 Feb;41(2):312-9. doi: 10.1124/dmd.112.049379. Epub 2012 Nov 13. Drug Metab Dispos. 2013. PMID: 23150428 Free PMC article.
-
Critical review of preclinical approaches to investigate cytochrome p450-mediated therapeutic protein drug-drug interactions and recommendations for best practices: a white paper.Drug Metab Dispos. 2013 Sep;41(9):1598-609. doi: 10.1124/dmd.113.052225. Epub 2013 Jun 21. Drug Metab Dispos. 2013. PMID: 23792813 Review.
Cited by
-
A case of chronic granulomatous disease and acne: is isotretinoin a safe treatment?Dermatol Reports. 2022 Dec 29;15(2):9631. doi: 10.4081/dr.2023.9631. eCollection 2023 Jun 7. Dermatol Reports. 2022. PMID: 37426369 Free PMC article.
-
Effect of isotretinoin on CYP2D6 and CYP3A activity in patients with severe acne.Br J Clin Pharmacol. 2024 Mar;90(3):759-768. doi: 10.1111/bcp.15938. Epub 2023 Nov 21. Br J Clin Pharmacol. 2024. PMID: 37864393 Free PMC article.
-
Plasma Retinoid Concentrations Are Altered in Pregnant Women.Nutrients. 2022 Mar 25;14(7):1365. doi: 10.3390/nu14071365. Nutrients. 2022. PMID: 35405978 Free PMC article.
-
Biochemical and physiological importance of the CYP26 retinoic acid hydroxylases.Pharmacol Ther. 2019 Dec;204:107400. doi: 10.1016/j.pharmthera.2019.107400. Epub 2019 Aug 13. Pharmacol Ther. 2019. PMID: 31419517 Free PMC article. Review.
-
LX-2 Stellate Cells Are a Model System for Investigating the Regulation of Hepatic Vitamin A Metabolism and Respond to Tumor Necrosis Factor α and Interleukin 1β.Drug Metab Dispos. 2024 Apr 16;52(5):442-454. doi: 10.1124/dmd.124.001679. Drug Metab Dispos. 2024. PMID: 38485281 Free PMC article.
References
-
- European Medicines Agency (EMA) . Guideline on the investigation of drug interactions. <https://www.ema.europa.eu/documents/scientific-guideline/guideline-inves...> 2012).
-
- US Food and Drug Administration (FDA) . Clinical Drug Interaction Studies – Study Design, Data Analysis, and Clinical Implications Guidance for Industry. <https://www.fda.gov/downloads/drugs/guidancecomplianceregulatoryinformat...> (2017).
-
- US Food and Drug Administration (FDA) . In Vitro Metabolism‐ and Transporter‐Mediated Drug‐Drug Interaction Studies Guidance for Industry. <https://www.fda.gov/downloads/Drugs/GuidanceComplianceRegulatoryInformat...> (2017).
-
- Intercept Pharmaceuticals Inc. OCALIVA (obeticholic acid) package insert. NDA number 207999. <https://ocalivahcp.com/> (2016).
-
- Hariparsad, N. et al Considerations from the IQ Induction Working Group in Response to Drug‐Drug Interaction Guidance from Regulatory Agencies: focus on downregulation, CYP2C induction, and CYP2B6 positive control. Drug Metab. Dispos. 45, 1049–1059 (2017). - PubMed
Publication types
MeSH terms
Substances
Grants and funding
LinkOut - more resources
Full Text Sources
Other Literature Sources
Medical
