

Association of the Great East Japan Earthquake and the Daiichi Nuclear Disaster in Fukushima City, Japan, With Birth Rates
- PMID: 30681714
- PMCID: PMC6484541
- DOI: 10.1001/jamanetworkopen.2018.7455
Association of the Great East Japan Earthquake and the Daiichi Nuclear Disaster in Fukushima City, Japan, With Birth Rates
Erratum in
-
Error in Sentence Wording.JAMA Netw Open. 2019 Feb 1;2(2):e190588. doi: 10.1001/jamanetworkopen.2019.0588. JAMA Netw Open. 2019. PMID: 30794290 Free PMC article. No abstract available.
Abstract
Importance: The association of the Great East Japan Earthquake and the subsequent Fukushima Daiichi Nuclear Power Plant disaster of March 11 and 12, 2011, in Fukushima, Japan, with birth rates has not been examined appropriately in the existing literature.
Objective: To assess the midterm and long-term associations of the Great East Japan Earthquake and the Fukushima Daiichi Nuclear Power Plant disaster with birth rates.
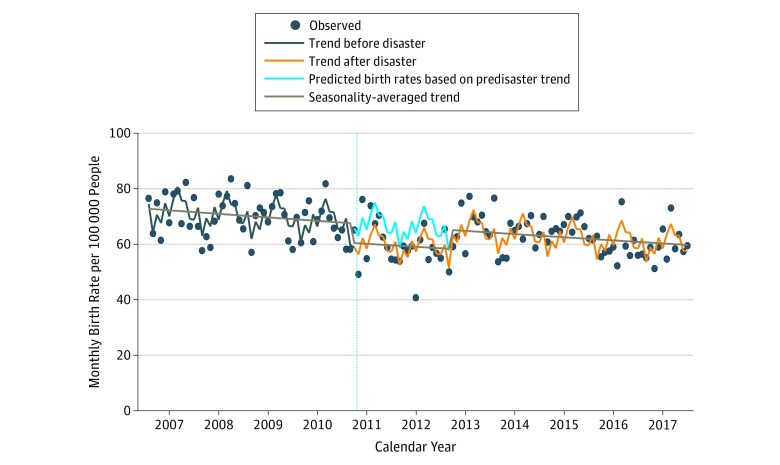
Design, setting, and participants: Cohort study in which interrupted time series analyses were used to assess monthly changes in birth rates among residents of Fukushima City, Japan, from March 1, 2011, to December 31, 2017, relative to projected birth rates without the disaster based on predisaster trends. Birth rates from January 1, 2007, to December 31, 2017, in Fukushima City were determined using information from the Fukushima City government office.
Exposure: The Great East Japan Earthquake and the Fukushima Daiichi Nuclear Power Plant disaster, expressed via 5 potential models of the association with birth rate: level change, level and slope changes, temporal level change, and temporal level change with 1 or 2 slope change(s).
Main outcomes and measures: Birth rate, calculated from monthly data on the number of births and total population.
Results: The mean birth rate before the Great East Japan Earthquake and the Fukushima Daiichi Nuclear Power Plant disaster was 69.8 per 100 000 people per month; after the disaster, the mean birth rate was 61.9 per 100 000 people per month. Compared with birth rates before the Great East Japan Earthquake and the Fukushima Daiichi Nuclear Power Plant disaster, there was an estimated 10% reduction in monthly birth rates in Fukushima City (rate ratio, 0.90; 95% CI, 0.86-0.93) in the first 2 years after the disaster. After that, the birth rate trend was similar to the predisaster trend. The predisaster trend suggested a continuous decrease in birth rate (rate ratio for 1 year, 0.98; 95% CI, 0.98-0.99). This gap model was optimal and parsimonious compared with others. A similar association was found when trimonthly averaged data were analyzed.
Conclusions and relevance: The Great East Japan Earthquake and the Fukushima Daiichi Nuclear Power Plant disaster were followed by significant reductions in birth rates for 2 years. There was insufficient evidence to indicate that the trend in the 3 to 7 years after the disaster differed from the predisaster trends. The recovery from the reductions in the birth rate may be indicative of the rebuilding efforts. The continuing long-term decrease in birth rates observed before the Great East Japan Earthquake and the Fukushima Daiichi Nuclear Power Plant disaster suggests that continuing measures to support birth planning should be considered at the administrative level.
Conflict of interest statement
Figures
Similar articles
-
Influence of the Great East Japan Earthquake and the Fukushima Daiichi nuclear disaster on the birth weight of newborns in Fukushima Prefecture: Fukushima Health Management Survey.J Matern Fetal Neonatal Med. 2017 Dec;30(24):2900-2904. doi: 10.1080/14767058.2016.1245718. Epub 2017 Jun 2. J Matern Fetal Neonatal Med. 2017. PMID: 27718768
-
The Great East Japan Earthquake, Tsunamis, and Fukushima Daiichi Nuclear Power Plant Disaster: Lessons for Evidence Integration from a WADEM 2017 Presentation and Panel Discussion.Prehosp Disaster Med. 2018 Aug;33(4):424-427. doi: 10.1017/S1049023X18000481. Epub 2018 Jul 2. Prehosp Disaster Med. 2018. PMID: 29962369
-
Effect of evacuation on liver function after the Fukushima Daiichi Nuclear Power Plant accident: The Fukushima Health Management Survey.J Epidemiol. 2017 Apr;27(4):180-185. doi: 10.1016/j.je.2016.05.006. Epub 2017 Jan 27. J Epidemiol. 2017. PMID: 28142046 Free PMC article.
-
[Report from Minamisoma City: diversity and complexity of psychological distress in local residents after a nuclear power plant accident].Seishin Shinkeigaku Zasshi. 2014;116(3):212-8. Seishin Shinkeigaku Zasshi. 2014. PMID: 24783444 Review. Japanese.
-
Mental Health Consequences of the Three Mile Island, Chernobyl, and Fukushima Nuclear Disasters: A Scoping Review.Int J Environ Res Public Health. 2021 Jul 13;18(14):7478. doi: 10.3390/ijerph18147478. Int J Environ Res Public Health. 2021. PMID: 34299933 Free PMC article.
Cited by
-
Error in Sentence Wording.JAMA Netw Open. 2019 Feb 1;2(2):e190588. doi: 10.1001/jamanetworkopen.2019.0588. JAMA Netw Open. 2019. PMID: 30794290 Free PMC article. No abstract available.
-
Changes in marriage, divorce and births during the COVID-19 pandemic in Japan.BMJ Glob Health. 2022 May;7(5):e007866. doi: 10.1136/bmjgh-2021-007866. BMJ Glob Health. 2022. PMID: 35569835 Free PMC article.
-
Awareness of Medical Radiologic Technologists of Ionizing Radiation and Radiation Protection.Int J Environ Res Public Health. 2022 Dec 28;20(1):497. doi: 10.3390/ijerph20010497. Int J Environ Res Public Health. 2022. PMID: 36612833 Free PMC article.
-
Fertility and contraception among women of reproductive age following a disaster: a scoping review.Reprod Health. 2022 Jun 23;19(1):147. doi: 10.1186/s12978-022-01436-4. Reprod Health. 2022. PMID: 35739557 Free PMC article.
-
Reduction in live births in Japan nine months after the Fukushima nuclear accident: An observational study.PLoS One. 2021 Feb 25;16(2):e0242938. doi: 10.1371/journal.pone.0242938. eCollection 2021. PLoS One. 2021. PMID: 33630835 Free PMC article.
References
-
- General Affairs Division, Social Health and Welfare Department, Fukushima Prefecture 2016 Overview of vital statistics (definite number), Fukushima Prefecture (in Japanese). https://www.pref.fukushima.lg.jp/uploaded/attachment/273189.pdf. Accessed November 2, 2018.
-
- The Sankei Shimbun & Sankei Digital Six years after the Great East Japan Earthquake: estimated number of births in Fukushima prefecture in 2016 reached record low levels and did not continue recovery (in Japanese). Sankei News March 9, 2017. http://www.sankei.com/life/print/170309/lif1703090012-c.html. Accessed September 6, 2018
MeSH terms
LinkOut - more resources
Full Text Sources
Medical
Miscellaneous
