. 2019 May;37(5):677-689.
doi: 10.1002/stem.2975. Epub 2019 Feb 6.

Periarticular Mesenchymal Progenitors Initiate and Contribute to Secondary Ossification Center Formation During Mouse Long Bone Development

Affiliations

Periarticular Mesenchymal Progenitors Initiate and Contribute to Secondary Ossification Center Formation During Mouse Long Bone Development

Wei Tong et al. Stem Cells. 2019 May.

Abstract

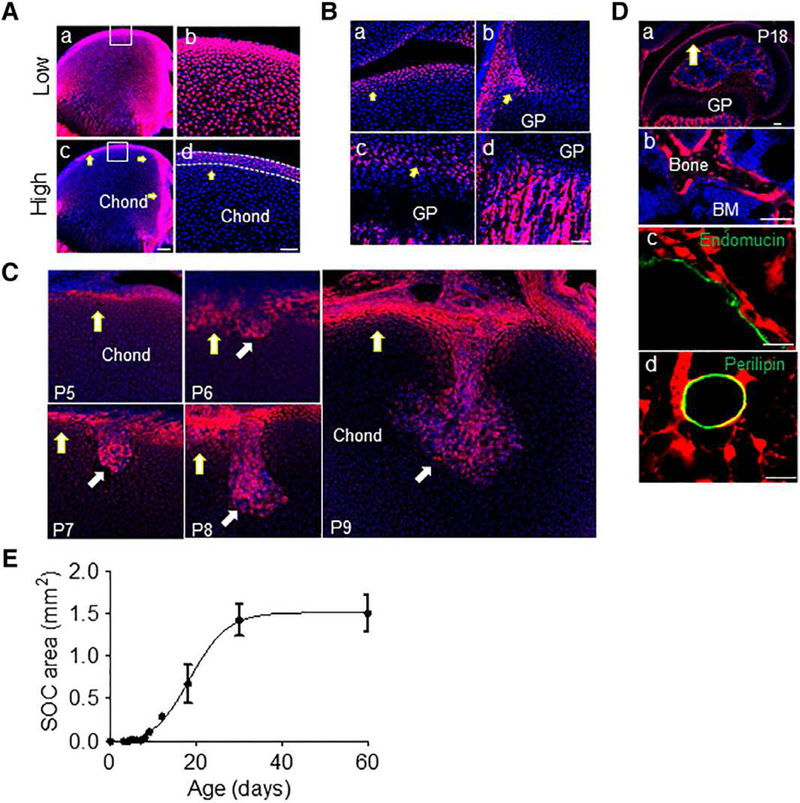
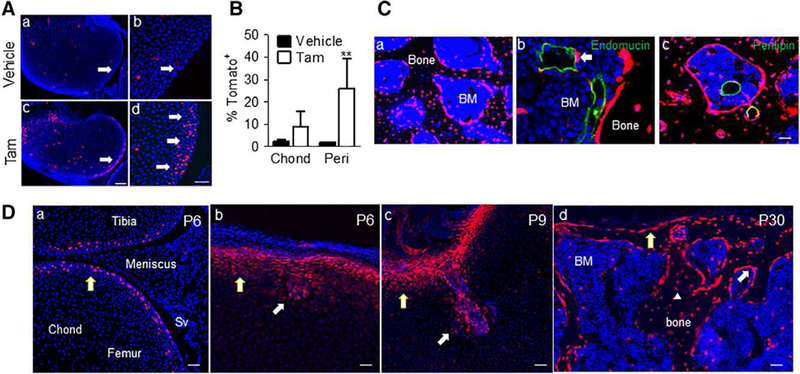
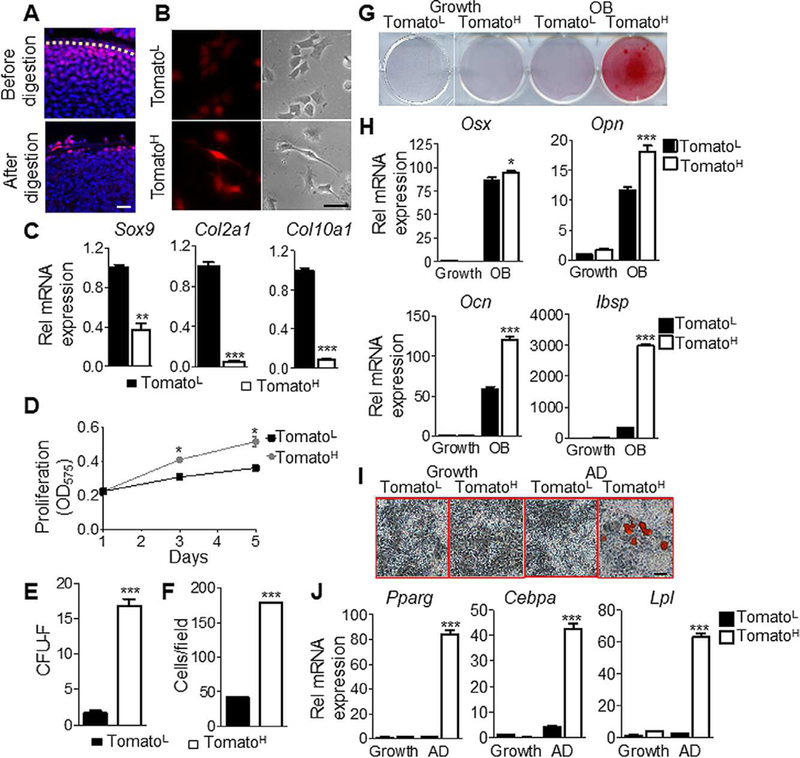
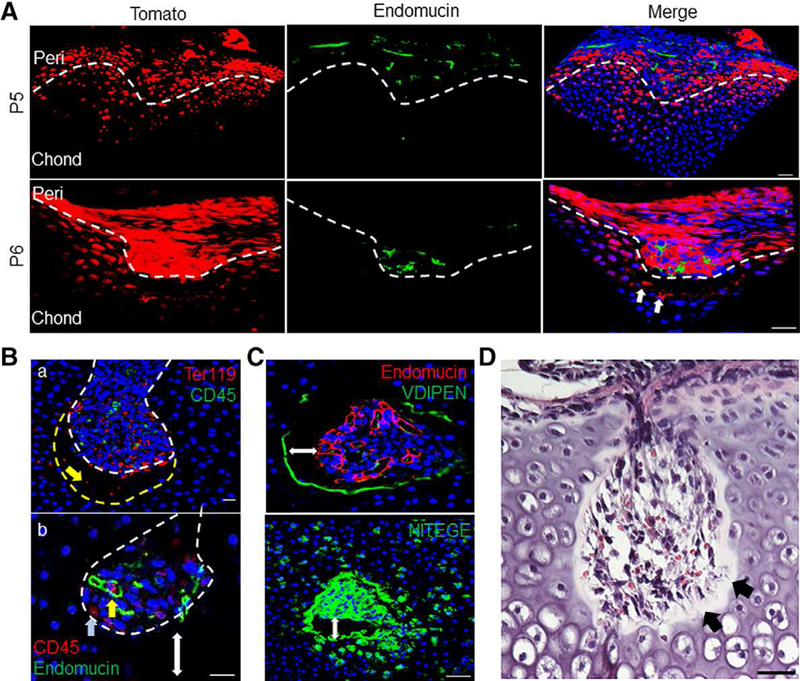
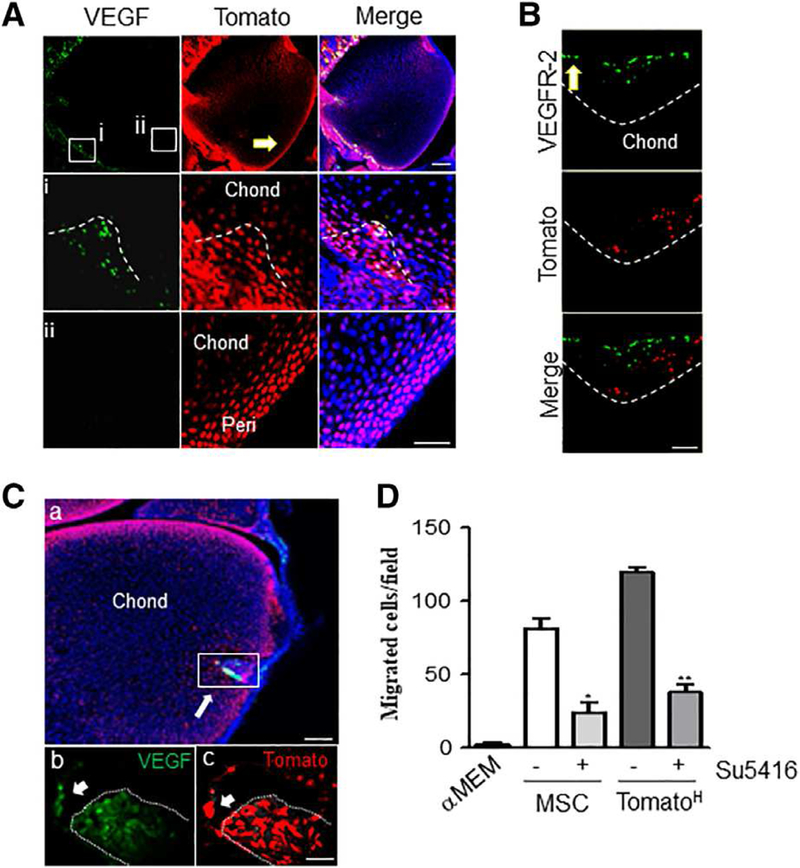
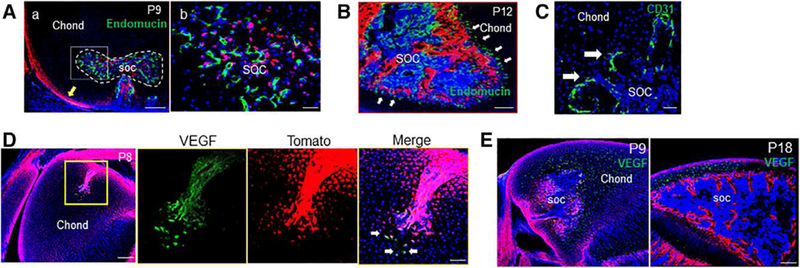
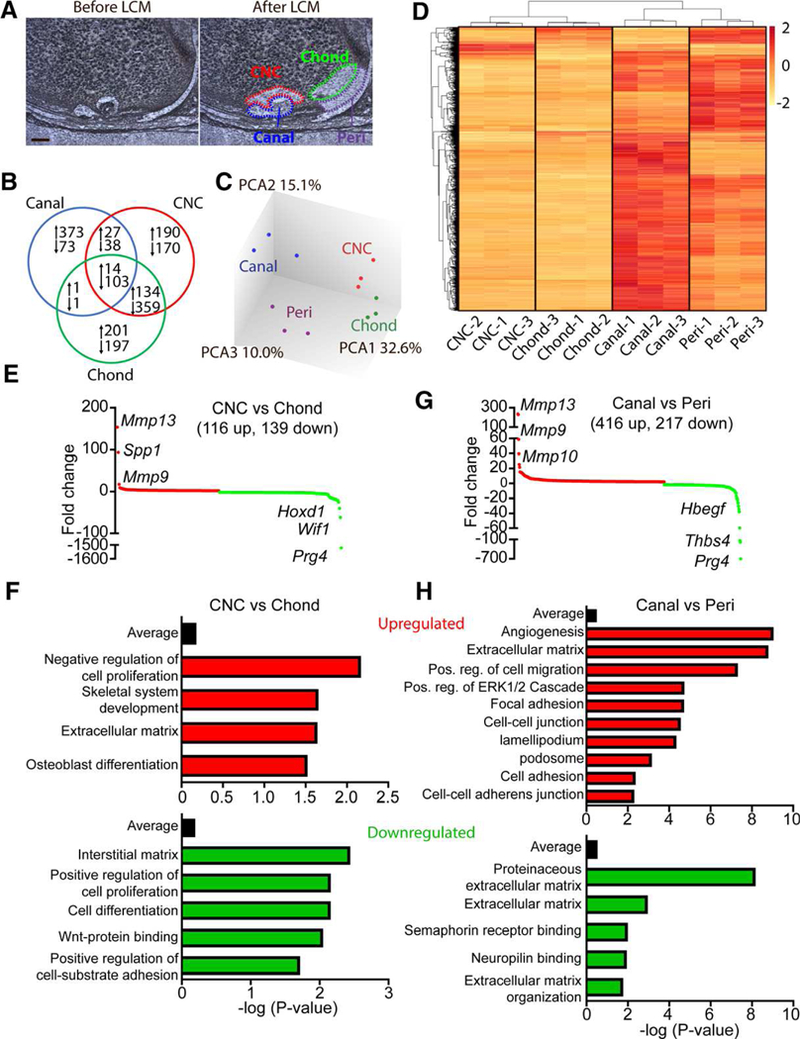
Long bone development involves the embryonic formation of a primary ossification center (POC) in the incipient diaphysis followed by postnatal development of a secondary ossification center (SOC) at each epiphysis. Studies have elucidated major basic mechanisms of POC development, but relatively little is known about SOC development. To gain insights into SOC formation, we used Col2-Cre Rosa-tdTomato (Col2/Tomato) reporter mice and found that their periarticular region contained numerous Tomato-positive lineage cells expressing much higher Tomato fluorescence (termed TomatoH ) than underlying epiphyseal chondrocytes (termed TomatoL ). With time, the TomatoH cells became evident at the SOC invagination site and cartilage canal, increased in number in the expanding SOC, and were present as mesenchymal lineage cells in the subchondral bone. These data were verified in two mouse lineage tracing models, Col2-CreER Rosa-tdTomato and Gli1-CreER Rosa-tdTomato. In vitro tests showed that the periarticular TomatoH cells from Col2/Tomato mice contained mesenchymal progenitors with multidifferentiation abilities. During canal initiation, the cells expressed vascular endothelial growth factor (VEGF) and migrated into epiphyseal cartilage ahead of individual or clusters of endothelial cells, suggesting a unique role in promoting vasculogenesis. Later during SOC expansion, chondrocytes in epiphyseal cartilage expressed VEGF, and angiogenic blood vessels preceded TomatoH cells. Gene expression analyses of microdissected samples revealed upregulation of MMPs in periarticular cells at the invagination site and suggested potential roles for novel kinase and growth factor signaling pathways in regulating SOC canal initiation. In summary, our data indicate that the periarticular region surrounding epiphyseal cartilage contains mesenchymal progenitors that initiate SOC development and form subchondral bone. Stem Cells 2019;37:677-689.

Keywords: Blood vessel; Cartilage; Mesenchymal progenitors; Periarticular layer; Secondary ossification center.


Conflict of interest statement

DISCLOSURE OF POTENTIAL CONFLICTS OF INTEREST

The authors indicated no potential conflicts of interest.

Figures

Figure 1.
Figure 1.
The highly fluorescent periarticular region in Col2/Tomato mice contains multipotent cells that forms the invading canal and reconstitutes subchondral bone. (A): A femur from P4 Col2/Tomato mouse was imaged by confocal microscopy and displayed at low (Aa, Ab) and high (Ac, Ad) intensity threshold. Yellow arrows point to TomatoH cells. The periarticular region was defined as the 4–6 layers of TomatoH cells along the epiphyseal surface (white dotted lines). Blue: DAPI. Bar = 200 μm (Aa, Ac), 50 μm (Ab, Ad). (B): High magnification images of the periarticular region (Ba), groove of Ranvier (Bb), growth plate (arrows point to the resting zone; Bc), and primary spongiosa (Bd) of the same femur showing labeling with high Tomato fluorescence. Bar = 50 μm. (C): Col2/Tomato mice were sacrificed postnatally at days indicated and the forming cartilage canal imaged by confocal microscopy. Bar = 100 μm. (D): By P18 (Da), TomatoH cells were found to give rise to osteoblasts and osteocytes (Db), pericytes along Endomucin+ blood vessels (Dc), and adipocytes (Dd). (Db), (Dc), and (Dd) are high magnification images from (Da). Bar = 200 μm (Da, Db), 25 μm (Dc, Dd). (E): Monitoring of secondary ossification center expansion revealed rapid growth during the invasion and expansion phases, with a maximum epiphyseal marrow area being reached by P30. Values represent averages ± SEM (n = 3–5/age).
Figure 2.
Figure 2.
Lineage tracing specifically labels periarticular cells which give rise to the invading canal and reconstitutes subchondral bone. (A): Tomato+ cells were predominantly found at the periarticular region (pointed by arrows) in Col2ER/Tomato mice at P5 after tamoxifen injection at P4. (Ab) and (Ad) are magnified images from (Aa) and (Ac), respectively. Bar = 200 μm (Aa and Ac), 50 μm (Ab and Ad). (B): Quantification of the number of Tomato+ cells in the chond and peri regions following tamoxifen injection; n = 3. Values represent average values ± SEM. **, p <.01 relative to vehicle control by two-way analysis of variance with Bonferroni’s post-test. (C): These mice were also found to have Tomato+ osteoblasts, osteocytes (Ca), perictyes (Cb), and adipocytes (Cc) at P60. Bar = 50 μm. (D): Gli1-CreER/ Tomato mice were injected with tamoxifen at P4 and sacrificed during canal initiation (P6), canal invasion (P9) and following secondary ossification center (SOC) formation (P30). Tomato signal was found to specifically label periarticular cells, the cartilage canal and mesenchymal lineage cells within the bone marrow following SOC formation, consistent with the TomatoH cells in the Col2/Tomato mice. Bar = 50 μm. Abbreviations: BM, bone marrow; Chond, Epiphyseal chondrocytes; Peri, periarticular; SV, synovium.
Figure 3.
Figure 3.
The periarticular region contains mesenchymal progenitors with increased osteogenic and adipogenic potential. (A): TomatoH and TomatoL cells were isolated by short-term or overnight enzymatic digestion, respectively. Bar = 50 μm. (B): Morphologically, TomatoL cells appear more rounded, characteristic of chondrocytes, whereas TomatoH cells appear more fibroblastic and elongated with increased fluorescence following adhesion. Bar = 10 μm. (C): Gene expression confirmed TomatoL cells expressed elevated levels of the chondro-genic markers Sox9, Col2, and Col10, relative to TomatoH cells. (D): TomatoH cells possessed significantly greater proliferation, as assessed by MTT assays. (E): TomatoH possess an increased colony forming ability. (F): TomatoH cells show increased migration rates, as assessed by trans-well assays. (G): TomatoH cells showed increased mineralization under osteogenic differentiation conditions. (H): TomatoH cells showed increased expression of the osteogenic markers Osx, Opn, Ocn, and Ibsp, relative to TomatoL cells, under osteogenic differentiation conditions. (I): Under adipogenic differentiation conditions, TomatoH cells show increased staining for lipid accumulation. Bar = 10 μm. (J): TomatoH cells expressed significantly elevated levels of the adipogenic markers Pparγ, Cebpa, and Lpl when cultured under adipogenic conditions. Graphs represent average values ±SEM. Data was analyzed by paired t test (C-F) or by repeated measures two-way analysis of variance with Bonferroni’s post-test (*, p <.05; **, p <.01; ***, p <.001; n = 3).
Figure 4.
Figure 4.
Canal invasion precedes endothelial cell recruitment and is led by chondrocyte extracellular matrix (ECM) degradation. (A): Canal initiation was led by TomatoH cells (white arrows) and trailed by blood vessels stained with the endothelial marker endomucin. Bar = 50 μm. (Ba): Canal invasion was preceded by an “empty space” between the canal front (dotted white line) and the surrounding chondrocytes (dotted yellow line), containing only Ter119+ erythroid lineage cells (yellow arrow). Bar = 20 μm. (Bb): Within the canal, CD45+ hematopoietic cells were either occasionally associated with immature vasculature (yellow arrow) or away from endothelial cells (blue arrow). Double-headed arrow shows gap between canal front and epiphyseal chondrocytes. Bar = 20 μm. (C): Immunofluorescent images show intense staining for chondrocyte ECM degradation around the invading canal. Double-headed arrow marks gap between canal and epiphyseal chondrocytes. Bar = 50 μm. (D): Staining with H&E confirmed a cell-free gap, with residual fiber or matrix components in the observed empty space (black arrows). Bar = 50 μm.
Figure 5.
Figure 5.
Secondary ossification center canal initiation and progression is led by perichondrial-derived Tomato cells independent of epiphyseal chondrocyte-derived vascular endothelial growth factor (VEGF) expression. (A): At P5, VEGF expression is confined to cells forming the canal and the neighboring periarticular region (Ai) while no signal was detected along the periarticular surface away from the canal (Aii). Dotted line depicts canal invasion site. Bar = 100 μm. (B): These leading cells are closely followed by a wave of VEGFR-2+ cells. Dotted line depicts canal front. Bar = 100 μm. (Ca): At P8, VEGF is expressed robustly by most cells of the canal, as well as a few chondrocytes in front of the advancing canal. Bar = 200 μm. (Cb, Cc): Magnified insert from (Ca). Arrow denotes TomatoH cells in front of canal positive for VEGF staining. Bar = 20 μm. (D): Trans-well migration of endothelial cells was conducted using conditioned media from mesenchymal stem cells orTomatoH cells and treatment with the VEGFR-2 inhibitor Su5416. TomatoH cells were found to induce endothelial cell migration in a VEGR-2-dependent manner. Graphs represent average values ± SEM. Data analyzed by repeat measures two-way analysis of variance with Bonferroni’s post-test (*, p <.05; **, p <.01; n = 3).
Figure 6.
Figure 6.
The transition from canal invasion to secondary ossification center (SOC) expansion is associated with altered sources of vascular endothelial growth factor (VEGF) and a spatial reorganization of blood vessels. (A): By P9, some mature vessels were visualized and present along the front of the expanding SOC canal (dotted line). Yellow arrow denotes periarticular surface. Bar = 200 μm (Aa), 50 μm (Ab). (B): By P12, endothelial cells were found to be ahead of the expanding TomatoH bone compartment (arrows). Bar = 200 μm. (C): These vessels were associated with a high density of angiogenic sprouts (arrows) along the invading front. Bar = 50 μm. (D): This change to a blood vessel-led SOC expansion was associated with a change in VEGF expression, with a few TomatoH and TomatoL cells out front of the invading canal (arrows) visibly expressing VEGF at P8. Bar = 200 μm, 50 μm. (E): At P9 and P18, VEGF production was detected by the majority of hypertrophic chondrocytes throughout the remaining epiphyseal chondrocytes. Bar = 200 μm.
Figure 7.
Figure 7.
Gene expression analyses associated with canal initiation and progression. (A): Laser capture microdissection was used to dissect the canal, chondrocytes near the canal (CNC), periarticular region (peri) and underlying chondrocytes (chond). Bar = 50 μm. (B): Gene expression analyses, with peri as the control tissue, showed 1,881 significantly regulated genes across the three isolated tissues. (C): PCA confirmed clustering of individual samples and showed notable changes between the peri and canal whereas more modest changes were observed between the CNC and chond. (D): Heat map of the 1,200 most regulated genes show robust gene expression changes during canal formation. (E): Differential expression profiles of significantly regulated genes from CNC relative to epiphyseal chondrocytes. Red denotes upregulated genes whereas green represents downregulated genes. Some of the most highly regulated genes have been listed. (F): Enrichment analysis of GO terms up and down-regulated in the CNC versus epiphyseal chondrocytes. (G): Differential expression profiles of significantly regulated genes from the canal relative to the periarticular region. Red denotes upregulated genes whereas green represents downregulated genes. Some of the most highly regulated genes have been listed. (H): Enrichment analysis of GO terms up and downregulated in the canal versus the periarticular region (n = 3).

Similar articles

Cited by

References

    1. Kronenberg HM Developmental regulation of the growth plate. Nature 2003;423: 332–336. - PubMed
    1. Long F, Ornitz DM Development of the endochondral skeleton. Cold Spring Harb Per-spect Biol 2013;5:a008334. - PMC - PubMed
    1. Hall BK, Miyake T All for one and one for all: Condensations and the initiation of skeletal development. Bioessays 2000;22:138–147. - PubMed
    1. Decker RS, Koyama E, Pacifici M Articular cartilage: Structural and developmental intricacies and questions. Curr Osteoporos Rep 2015; 13:407–414. - PMC - PubMed
    1. Pacifici M, Koyama E, Iwamoto M et al. Development of articular cartilage: What do we know about it and how may it occur? Connect Tissue Res 2000;41:175–184. - PubMed

Publication types

MeSH terms

Substances