. 2019 Apr 5;12(7):1349-1360.
doi: 10.1002/cssc.201900007. Epub 2019 Feb 27.

A Prospective Life Cycle Assessment (LCA) of Monomer Synthesis: Comparison of Biocatalytic and Oxidative Chemistry

Affiliations

A Prospective Life Cycle Assessment (LCA) of Monomer Synthesis: Comparison of Biocatalytic and Oxidative Chemistry

Marie A F Delgove et al. ChemSusChem. .

Abstract

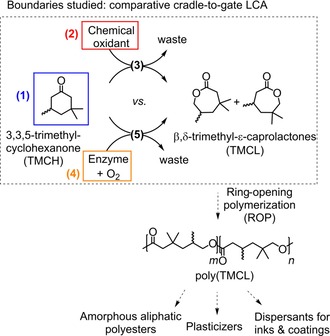
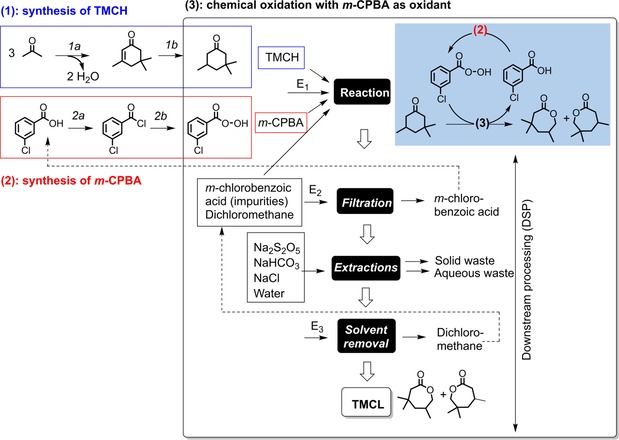
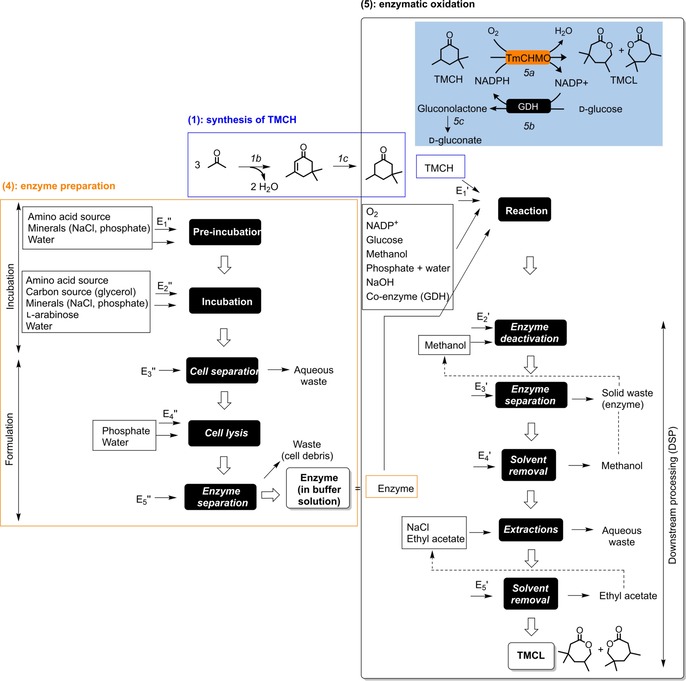
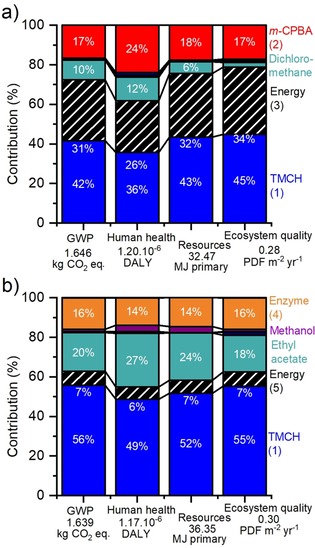
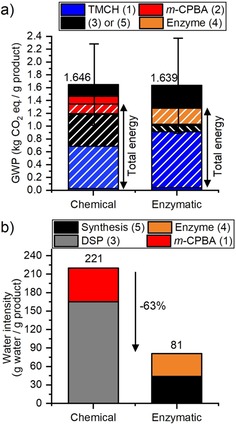
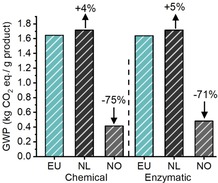
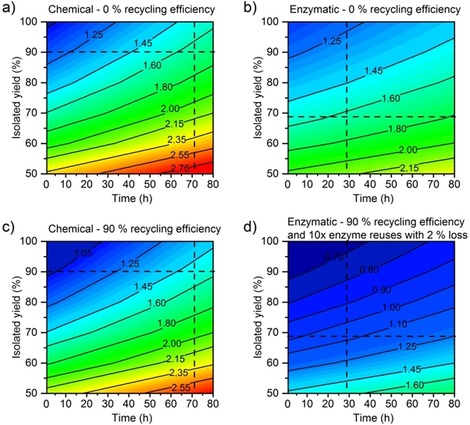
Biotechnological processes are typically perceived to be greener than chemical processes. A life cycle assessment (LCA) was performed to compare the chemical and biochemical synthesis of lactones obtained by Baeyer-Villiger oxidation. The LCA is prospective (based on experiments at a small scale with primary data) because the process is at an early stage. The results show that the synthesis route has no significant effect on the climate change impact [(1.65±0.59) kg CO 2 gproduct -1 vs. (1.64±0.67) kg CO 2 gproduct -1 ]. Key process performance metrics affecting the environmental impact were evaluated by performing a sensitivity analysis. Recycling of solvents and enzyme were shown to provide an advantage to the enzymatic synthesis. Additionally, the climate change impact was decreased by 71 % if renewable electricity was used. The study shows that comparative LCAs can be used to usefully support decisions at an early stage of process development.

Keywords: biocatalysis; life cycle assessment; oxidative chemistry; process metrics; sustainable chemistry.


Conflict of interest statement

The authors declare no conflict of interest.

Figures

Figure 1
Figure 1
Boundaries studied for the synthesis of the product (TMCL): comparative cradle‐to‐gate assessment comprising (1) the synthesis of the substrate (TMCH), (2) the synthesis of the chemical oxidant, (3) the synthesis of the product by using a chemical oxidant, (4) the enzyme preparation, and (5) the enzymatic synthesis of the product by using a Baeyer–Villiger monooxygenase (BVMO). All reactions include DSP.
Figure 2
Figure 2
Process flowsheet for the chemical synthesis of the product TMCL (3), describing the synthesis of the substrate (1) and the synthesis of the chemical oxidant m‐CPBA (2). Reaction conditions: 1 a) base‐catalyzed aldol condensation (KOH, 90 °C, 20 h), 1 b) Pd‐catalyzed hydrogenation (supercritical CO2, 104–116 °C), 2 a) chlorination (SOCl2, 70 °C, 4 h), 2 b) nucleophilic reaction with hydrogen peroxide (H2O2, aq. NaOH, dioxane, MgSO4, dioxane, 15 min), 3) chemical Baeyer–Villiger oxidation (RT, 72 h). Electricity consumptions are indicated as Ei (see Table S1 in the Supporting Information for details). Dotted arrows indicate potential recycled streams (in the sensitivity analysis only).
Figure 3
Figure 3
Process flowsheet for the enzymatic synthesis of the product TMCL (5), describing the synthesis of the substrate TMCH (1) and the preparation of the enzyme (4). Reaction conditions: 1 a) base‐catalyzed aldol condensation (KOH, 90 °C, 20 h), 1 b) Pd‐catalyzed hydrogenation (supercritical CO2, 104–116 °C), 5) enzymatic Baeyer–Villiger oxidation (30 °C, 28 h) with 5 a) oxidation, 5 b) co‐factor regeneration, and 5 c) spontaneous hydrolysis of the co‐product. Electricity consumptions are indicated as Ei′ and Ei′′ (see Table S1 in the Supporting Information for details). Dotted arrows indicate potential recycled streams (in the sensitivity analysis only).
Figure 4
Figure 4
Contribution distribution for four environmental impact categories for a) chemical synthesis and b) enzymatic synthesis. The energy contribution is the electricity used for the oxidation synthesis only. The percentages of contributions lower than 3 % are not indicated. The total values for each impact category are indicated below the x axis.
Figure 5
Figure 5
Performances of the chemical and enzymatic reactions with a) GWP and b) water intensity. The values on top of the columns indicate the total GWP and total water intensity, respectively. Stripped bars indicate contributions owing to electricity consumption. The error bars indicate the standard deviations for the GWP.
Figure 6
Figure 6
Evolution of GWP for the chemical and enzymatic synthesis as a function of the electricity source, with average from Europe (EU, GWP=0.49 kgCO2equiv.  kWh−1), the Netherlands (NL, GWP=0.55 kgCO2equiv.  kWh−1), and Norway (NO, GWP=0.04 kgCO2equiv.  kWh−1). The percentages on top of the columns indicate the difference of GWP compared with the EU electricity source.
Figure 7
Figure 7
a) GWP as a function of the recycling efficiency of co‐product (m‐chlorobenzoic acid) and solvent for the chemical and enzymatic syntheses, and b) comparison of the total GWP of the syntheses with 90 % recycling efficiency of solvents with the replacement with peracetic acid (chemical synthesis) and reutilization of the enzyme (enzymatic synthesis) with either whole‐cells in buffer (total GWP=1.080 kgCO2equiv.  gproduct −1) or whole‐cells in fermentation broth (total GWP=1.079 kgCO2equiv.  gproduct −1). The values on top of the bars indicate the total GWP.
Figure 8
Figure 8
Evolution of GWP (kgCO2equiv.  gproduct −1) as a function of the reaction time and the isolated yield for a) the chemical synthesis with m‐CPBA without recycling, b) the enzymatic synthesis without recycling, c) the chemical synthesis with m‐CPBA with 90 % recycling efficiency of solvents and co‐product, and d) the enzymatic synthesis with 90 % recycling efficiency of solvents and reuse of enzyme (10 cycles with 2 % loss). The intersection of the dotted lines indicates the current isolated yield and reaction time.

References

    1. Wenda S., Illner S., Mell A., Kragl U., Green Chem. 2011, 13, 3007–3047.
    1. None
    1. Industrial Biotransformations (Eds.: A. Liese, K. Seelbach, C. Wandrey), Wiley-VCH, Weinheim, 2006;
    1. Straathof A. J. J., Panke S., Schmid A., Curr. Opin. Biotechnol. 2002, 13, 548–556. - PubMed
    1. None