Review
. 2019 Mar-Apr;39(2):307-318.
doi: 10.1148/rg.2019180124. Epub 2019 Jan 25.

Calcifications at Digital Breast Tomosynthesis: Imaging Features and Biopsy Techniques

Affiliations
Review

Calcifications at Digital Breast Tomosynthesis: Imaging Features and Biopsy Techniques

Joao V Horvat et al. Radiographics. 2019 Mar-Apr.

Abstract

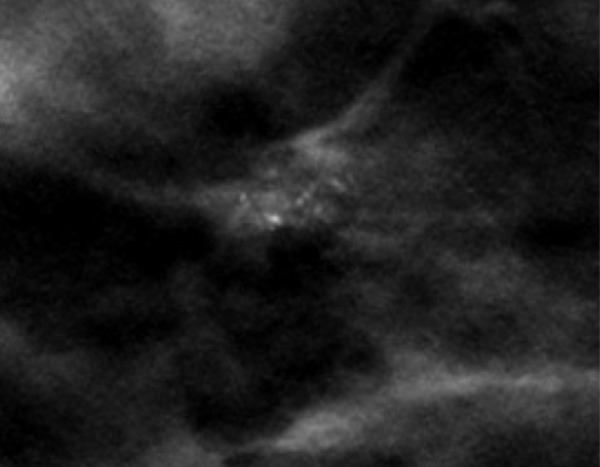
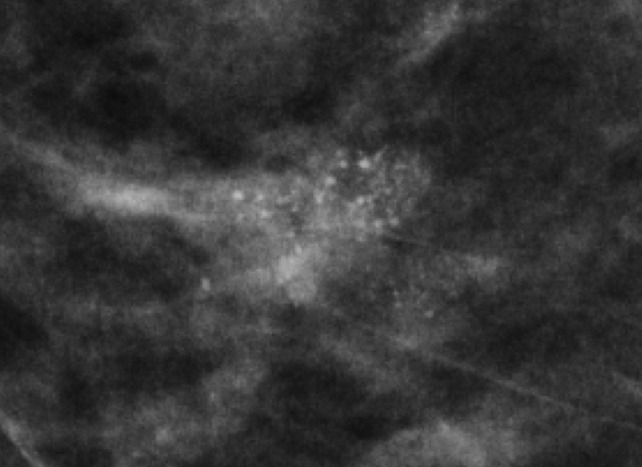
Full-field digital mammography (FFDM), the standard of care for breast cancer screening, has some limitations. With the advent of digital breast tomosynthesis (DBT), improvements including decreased recall rates and increased cancer detection rates have been observed. The quasi-three-dimensional capability of DBT reduces breast tissue overlap, a significant limitation of FFDM. However, early studies demonstrate that a few cancers detected at FFDM may not be diagnosed at DBT-only screening, and lesions with calcifications as the dominant feature may look less suspicious at DBT or not be visible at all. These findings support the use of combined FFDM and DBT protocols to optimize screening performance. However, this combination would approximately double the patient's radiation exposure. The development of computer algorithms that generate two-dimensional synthesized mammography (SM) views from DBT has improved calcification conspicuity and sensitivity. Therefore, SM may substitute for FFDM in screening protocols, reducing radiation exposure. DBT plus SM demonstrates significantly better performance than that of FFDM alone, although there are reports of missed malignant calcifications. Thus, some centers continue to perform FFDM with DBT. Use of DBT in breast imaging has also necessitated the development of DBT-guided biopsy. DBT-guided biopsy may have a higher success rate than that of stereotactic biopsy, with a shorter procedure time. While DBT brings substantial improvements to breast cancer imaging, it is important to be aware of its strengths and limitations regarding detection of calcifications. This article reviews the imaging appearance of breast calcifications at DBT, discusses calcification biopsy techniques, and provides an overview of the current literature. Online supplemental material is available for this article. ©RSNA, 2019 An earlier incorrect version of this article appeared online. This article was corrected on February 13, 2019.


Figures

Figure 1.
Figure 1.
Chart categorizes and illustrates the various types of calcification morphology depicted at mammography. Calcification morphology is classified as typically benign or suspicious. (Descriptors are from reference .)
Figure 2a.
Figure 2a.
Skin calcifications. Mediolateral oblique (MLO) full-field digital mammogram (a), MLO DBT image (b) (image number 7 out of 40), and FFDM tangential view (c) show calcifications (arrow) within the skin. Skin calcifications may not appear on the first or last three DBT images if the skin containing the calcifications is not touching the equipment, and additional imaging may be required.
Figure 2b.
Figure 2b.
Skin calcifications. Mediolateral oblique (MLO) full-field digital mammogram (a), MLO DBT image (b) (image number 7 out of 40), and FFDM tangential view (c) show calcifications (arrow) within the skin. Skin calcifications may not appear on the first or last three DBT images if the skin containing the calcifications is not touching the equipment, and additional imaging may be required.
Figure 2c.
Figure 2c.
Skin calcifications. Mediolateral oblique (MLO) full-field digital mammogram (a), MLO DBT image (b) (image number 7 out of 40), and FFDM tangential view (c) show calcifications (arrow) within the skin. Skin calcifications may not appear on the first or last three DBT images if the skin containing the calcifications is not touching the equipment, and additional imaging may be required.
Figure 3.
Figure 3.
MLO DBT image shows vascular calcifications. The tubular parallel orientation of vascular calcifications may be better depicted at DBT than at FFDM.
Figure 4.
Figure 4.
MLO DBT image shows an oval circumscribed mass containing coarse calcifications, a finding consistent with a calcified fibroadenoma. Coarse calcifications and an associated mass may be better depicted at DBT than at FFDM.
Figure 5a.
Figure 5a.
Calcification within the walls of an oil cyst. (a) MLO full-field digital mammogram shows calcified walls of an oil cyst (arrow), which are clearly visible. (b) MLO synthetic mammogram shows the calficifed cyst wall (arrow), but the associated oil cyst is not as clearly depicted as on the MLO full-field digital mammogram. (c) MLO DBT image shows the same oil cyst (arrow) and a smaller adjacent oil cyst (arrowhead).
Figure 5b.
Figure 5b.
Calcification within the walls of an oil cyst. (a) MLO full-field digital mammogram shows calcified walls of an oil cyst (arrow), which are clearly visible. (b) MLO synthetic mammogram shows the calficifed cyst wall (arrow), but the associated oil cyst is not as clearly depicted as on the MLO full-field digital mammogram. (c) MLO DBT image shows the same oil cyst (arrow) and a smaller adjacent oil cyst (arrowhead).
Figure 5c.
Figure 5c.
Calcification within the walls of an oil cyst. (a) MLO full-field digital mammogram shows calcified walls of an oil cyst (arrow), which are clearly visible. (b) MLO synthetic mammogram shows the calficifed cyst wall (arrow), but the associated oil cyst is not as clearly depicted as on the MLO full-field digital mammogram. (c) MLO DBT image shows the same oil cyst (arrow) and a smaller adjacent oil cyst (arrowhead).
Figure 6a.
Figure 6a.
Amorphous calcification groups (circle outlines) in the right breast in a 56-year-old woman with ductal carcinoma in situ (DCIS). (a) MLO full-field digital mammogram shows three groups of amorphous calcifications. The upper group (yellow circle) shows greater conspicuity in comparison to that of the lower group (red circle). (b) MLO synthetic mammogram shows the three groups of amorphous calcifications with better conspicuity in the lower group (red circle) in comparison to those depicted at FFDM. At DBT (Movie 1), all three amorphous groups are clearly visible.
Figure 6b.
Figure 6b.
Amorphous calcification groups (circle outlines) in the right breast in a 56-year-old woman with ductal carcinoma in situ (DCIS). (a) MLO full-field digital mammogram shows three groups of amorphous calcifications. The upper group (yellow circle) shows greater conspicuity in comparison to that of the lower group (red circle). (b) MLO synthetic mammogram shows the three groups of amorphous calcifications with better conspicuity in the lower group (red circle) in comparison to those depicted at FFDM. At DBT (Movie 1), all three amorphous groups are clearly visible.
Figure 7a.
Figure 7a.
Segmental fine pleomorphic and fine-linear branching calcifications in a 57-year-old woman. MLO DBT image (a), MLO full-field digital mammogram (b), and magnification view of the mediolateral full-field digital mammogram (c) show segmental fine pleomorphic and fine-linear branching calcifications in the right breast. The results of a biopsy confirmed DCIS.
Figure 7b.
Figure 7b.
Segmental fine pleomorphic and fine-linear branching calcifications in a 57-year-old woman. MLO DBT image (a), MLO full-field digital mammogram (b), and magnification view of the mediolateral full-field digital mammogram (c) show segmental fine pleomorphic and fine-linear branching calcifications in the right breast. The results of a biopsy confirmed DCIS.
Figure 7c.
Figure 7c.
Segmental fine pleomorphic and fine-linear branching calcifications in a 57-year-old woman. MLO DBT image (a), MLO full-field digital mammogram (b), and magnification view of the mediolateral full-field digital mammogram (c) show segmental fine pleomorphic and fine-linear branching calcifications in the right breast. The results of a biopsy confirmed DCIS.
Figure 8a.
Figure 8a.
(a, b) MLO full-field digital mammogram (a) shows dense calcifications, with associated shadowing artifacts (arrows in b) on the MLO synthetic mammogram (b). Shadowing artifact may occur on synthesized mammograms and can jeopardize the evaluation of adjacent lesions. (c) MLO DBT image shows zipper artifacts (arrows), which are out-of-plane image repetitions that may also be seen with dense calcifications.
Figure 8b.
Figure 8b.
(a, b) MLO full-field digital mammogram (a) shows dense calcifications, with associated shadowing artifacts (arrows in b) on the MLO synthetic mammogram (b). Shadowing artifact may occur on synthesized mammograms and can jeopardize the evaluation of adjacent lesions. (c) MLO DBT image shows zipper artifacts (arrows), which are out-of-plane image repetitions that may also be seen with dense calcifications.
Figure 8c.
Figure 8c.
(a, b) MLO full-field digital mammogram (a) shows dense calcifications, with associated shadowing artifacts (arrows in b) on the MLO synthetic mammogram (b). Shadowing artifact may occur on synthesized mammograms and can jeopardize the evaluation of adjacent lesions. (c) MLO DBT image shows zipper artifacts (arrows), which are out-of-plane image repetitions that may also be seen with dense calcifications.
Figure 9a.
Figure 9a.
Grouped amorphous calcifications in a 61-year-old woman. (a, b) MLO full-field digital mammogram (a) and MLO DBT image (b) show similar conspicuity of grouped amorphous calcifications. (c) Mediolateral magnified view of the full-field digital mammogram shows calcifications with greater conspicuity than those seen in a and b, which better demonstrates their extent, number, and morphology. The results of a biopsy confirmed DCIS.
Figure 9b.
Figure 9b.
Grouped amorphous calcifications in a 61-year-old woman. (a, b) MLO full-field digital mammogram (a) and MLO DBT image (b) show similar conspicuity of grouped amorphous calcifications. (c) Mediolateral magnified view of the full-field digital mammogram shows calcifications with greater conspicuity than those seen in a and b, which better demonstrates their extent, number, and morphology. The results of a biopsy confirmed DCIS.
Figure 9c.
Figure 9c.
Grouped amorphous calcifications in a 61-year-old woman. (a, b) MLO full-field digital mammogram (a) and MLO DBT image (b) show similar conspicuity of grouped amorphous calcifications. (c) Mediolateral magnified view of the full-field digital mammogram shows calcifications with greater conspicuity than those seen in a and b, which better demonstrates their extent, number, and morphology. The results of a biopsy confirmed DCIS.

References

    1. Tabár L, Vitak B, Chen TH, et al. Swedish two-county trial: impact of mammographic screening on breast cancer mortality during 3 decades. Radiology 2011;260(3):658–663. - PubMed
    1. Plecha D, Salem N, Kremer M, et al. Neglecting to screen women between 40 and 49 years old with mammography: what is the impact on treatment morbidity and potential risk reduction? AJR Am J Roentgenol 2014;202(2):282–288. - PubMed
    1. de Munck L, de Bock GH, Otter R, et al. Digital vs screen-film mammography in population-based breast cancer screening: performance indicators and tumour characteristics of screen-detected and interval cancers. Br J Cancer 2016;115(5):517–524. - PMC - PubMed
    1. Théberge I, Vandal N, Langlois A, Pelletier É, Brisson J. Detection rate, recall rate, and positive predictive value of digital compared to screen-film mammography in the Quebec population-based breast cancer screening program. Can Assoc Radiol J 2016;67(4):330–338. - PubMed
    1. Souza FH, Wendland EM, Rosa MI, Polanczyk CA. Is full-field digital mammography more accurate than screen-film mammography in overall population screening? A systematic review and meta-analysis. Breast 2013;22(3):217–224. - PubMed