

Quantitative analysis of F-actin alterations in adherent human mesenchymal stem cells: Influence of slow-freezing and vitrification-based cryopreservation
- PMID: 30682146
- PMCID: PMC6347223
- DOI: 10.1371/journal.pone.0211382
Quantitative analysis of F-actin alterations in adherent human mesenchymal stem cells: Influence of slow-freezing and vitrification-based cryopreservation
Abstract
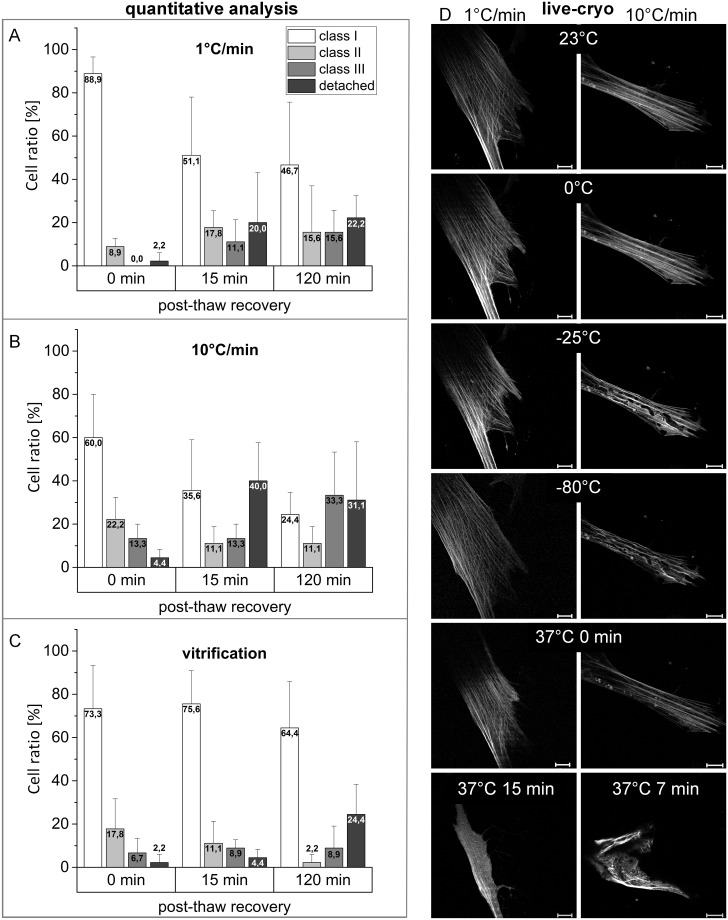
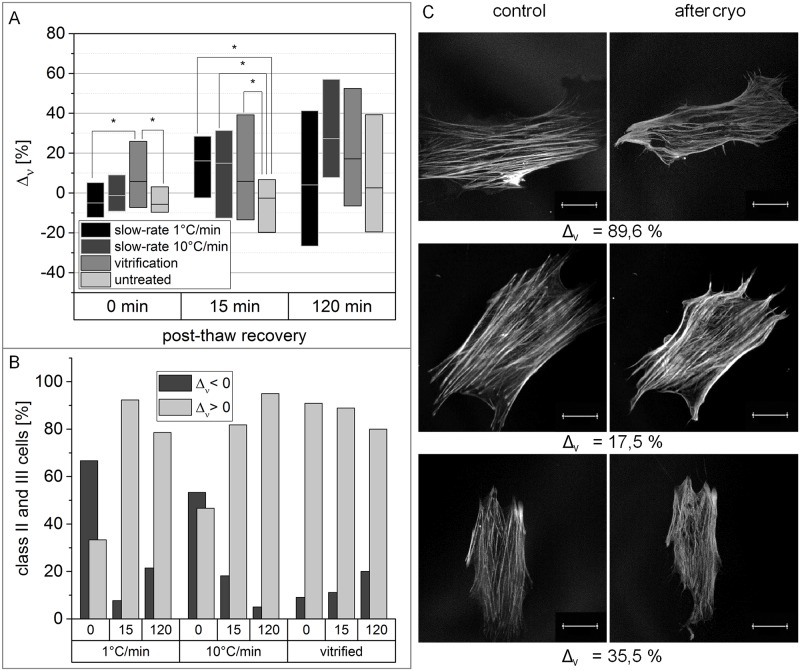
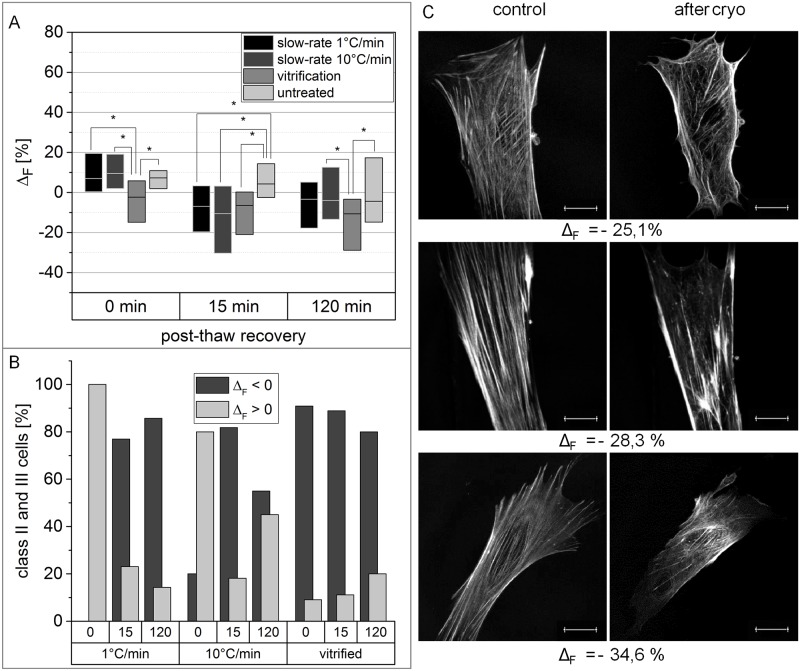
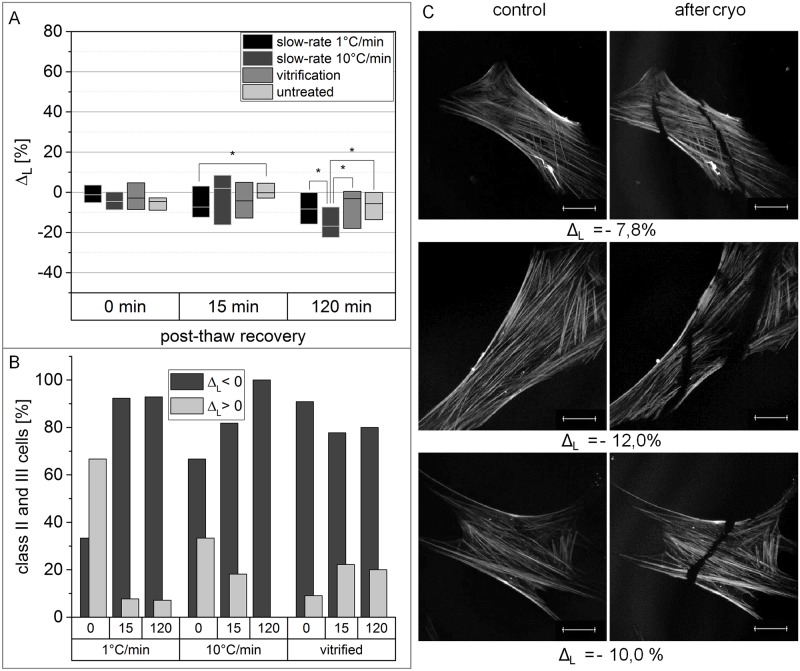
Cryopreservation is an essential tool to meet the increasing demand for stem cells in medical applications. To ensure maintenance of cell function upon thawing, the preservation of the actin cytoskeleton is crucial, but so far there is little quantitative data on the influence of cryopreservation on cytoskeletal structures. For this reason, our study aims to quantitatively describe cryopreservation induced alterations to F-actin in adherent human mesenchymal stem cells, as a basic model for biomedical applications. Here we have characterised the actin cytoskeleton on single-cell level by calculating the circular standard deviation of filament orientation, F-actin content, and average filament length. Cryo-induced alterations of these parameters in identical cells pre and post cryopreservation provide the basis of our investigation. Differences between the impact of slow-freezing and vitrification are qualitatively analyzed and highlighted. Our analysis is supported by live cryo imaging of the actin cytoskeleton via two photon microscopy. We found similar actin alterations in slow-frozen and vitrified cells including buckling of actin filaments, reduction of F-actin content and filament shortening. These alterations indicate limited functionality of the respective cells. However, there are substantial differences in the frequency and time dependence of F-actin disruptions among the applied cryopreservation strategies; immediately after thawing, cytoskeletal structures show least disruption after slow freezing at a rate of 1°C/min. As post-thaw recovery progresses, the ratio of cells with actin disruptions increases, particularly in slow frozen cells. After 120 min of recovery the proportion of cells with an intact actin cytoskeleton is higher in vitrified than in slow frozen cells. Freezing at 10°C/min is associated with a high ratio of impaired cells throughout the post-thawing culture.
Conflict of interest statement
The authors have declared that no competing interests exist.
Figures
Similar articles
-
State of actin cytoskeleton and development of slow-frozen and vitrified rabbit pronuclear zygotes.Cryobiology. 2016 Feb;72(1):14-20. doi: 10.1016/j.cryobiol.2015.11.009. Epub 2015 Dec 11. Cryobiology. 2016. PMID: 26687386
-
Influence of cell loss after vitrification or slow-freezing on further in vitro development and implantation of human Day 3 embryos.Hum Reprod. 2013 Nov;28(11):2943-9. doi: 10.1093/humrep/det356. Epub 2013 Sep 5. Hum Reprod. 2013. PMID: 24014599
-
Survivability of rabbit amniotic fluid-derived mesenchymal stem cells post slow-freezing or vitrification.Acta Histochem. 2019 May;121(4):491-499. doi: 10.1016/j.acthis.2019.03.008. Epub 2019 Apr 17. Acta Histochem. 2019. PMID: 31005288
-
Vitrification and conventional freezing methods in sperm cryopreservation: A systematic review and meta-analysis.Eur J Obstet Gynecol Reprod Biol. 2019 Feb;233:84-92. doi: 10.1016/j.ejogrb.2018.11.028. Epub 2018 Dec 14. Eur J Obstet Gynecol Reprod Biol. 2019. PMID: 30580229
-
Slow freezing or vitrification of oocytes: their effects on survival and meiotic spindles, and the time schedule for clinical practice.Taiwan J Obstet Gynecol. 2009 Mar;48(1):15-22. doi: 10.1016/S1028-4559(09)60030-9. Taiwan J Obstet Gynecol. 2009. PMID: 19346187 Review.
Cited by
-
Dimethyl Sulfoxide-Free Cryopreservation of Human Umbilical Cord Mesenchymal Stem Cells Based on Zwitterionic Betaine and Electroporation.Int J Mol Sci. 2021 Jul 12;22(14):7445. doi: 10.3390/ijms22147445. Int J Mol Sci. 2021. PMID: 34299064 Free PMC article.
-
Unraveling the mechanisms of cardiolipin function: The role of oxidative polymerization of unsaturated acyl chains.Redox Biol. 2023 Aug;64:102774. doi: 10.1016/j.redox.2023.102774. Epub 2023 Jun 4. Redox Biol. 2023. PMID: 37300954 Free PMC article.
-
Comparative Analysis of the Therapeutic Effects of Fresh and Cryopreserved Human Umbilical Cord Derived Mesenchymal Stem Cells in the Treatment of Psoriasis.Stem Cell Rev Rep. 2023 Aug;19(6):1922-1936. doi: 10.1007/s12015-023-10556-8. Epub 2023 May 18. Stem Cell Rev Rep. 2023. PMID: 37199874
-
Cryopreservation of Liver-Cell Spheroids with Macromolecular Cryoprotectants.ACS Appl Mater Interfaces. 2023 Jan 18;15(2):2630-2638. doi: 10.1021/acsami.2c18288. Epub 2023 Jan 9. ACS Appl Mater Interfaces. 2023. PMID: 36621888 Free PMC article.
-
Low-Molecular-Weight PEGs for Cryopreservation of Stem Cell Spheroids.Biomater Res. 2024 Jun 6;28:0037. doi: 10.34133/bmr.0037. eCollection 2024. Biomater Res. 2024. PMID: 38845843 Free PMC article.
References
-
- Keung E, Nelson P, Conrad C. Concise Review: Adipose-Derived Stem Cells as a Novel Tool for Future Regenerative Medicine. Stem Cells. 2013;30:804–10. - PubMed
-
- Segers VFM, Lee RT. Stem-cell therapy for cardiac disease. Nature [Internet]. 2008;451(7181):937–42. Available from: http://www.nature.com/doifinder/10.1038/nature06800 - DOI - PubMed
-
- Toner M, Cravalho EG, Karel M. Thermodynamics and kinetics of intracellular ice formation during freezing of biological cells. J Appl Phys. 1990;67(1582):1582–93.
MeSH terms
Substances
LinkOut - more resources
Full Text Sources
Research Materials
