. 2019 May:58:82-89.
doi: 10.1016/j.mri.2019.01.018. Epub 2019 Jan 22.

A fiber coherence index for quality control of B-table orientation in diffusion MRI scans

Affiliations

A fiber coherence index for quality control of B-table orientation in diffusion MRI scans

Kurt G Schilling et al. Magn Reson Imaging. 2019 May.

Abstract

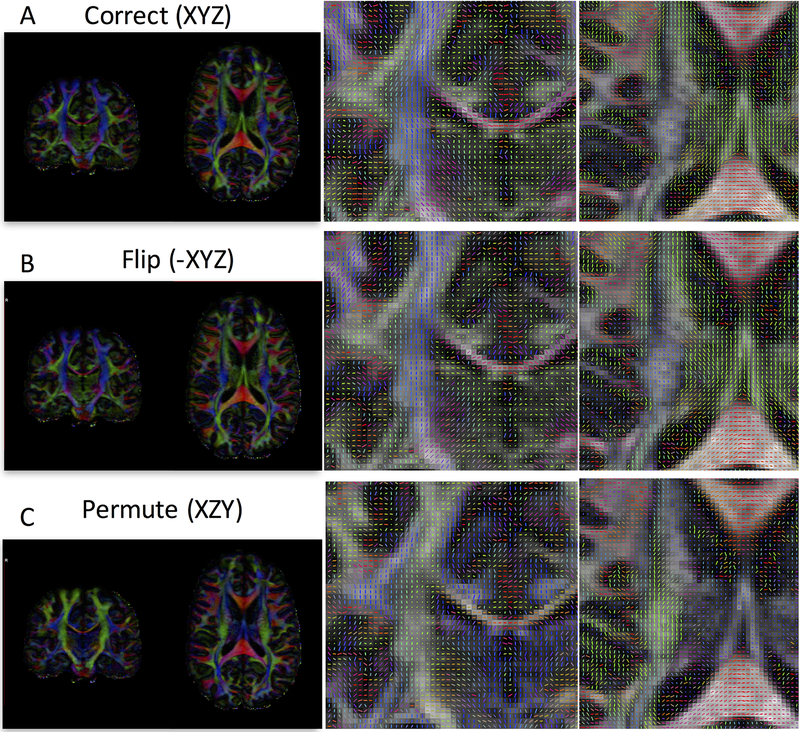
Purpose: The diffusion MRI "b-vector" table describing the diffusion sensitization direction can be flipped and permuted in dimension due to different orientation conventions used in scanners and incorrect or improperly utilized file formats. This can lead to incorrect fiber orientation estimates and subsequent tractography failure. Here, we present an automated quality control procedure to detect when the b-table is flipped and/or permuted incorrectly.

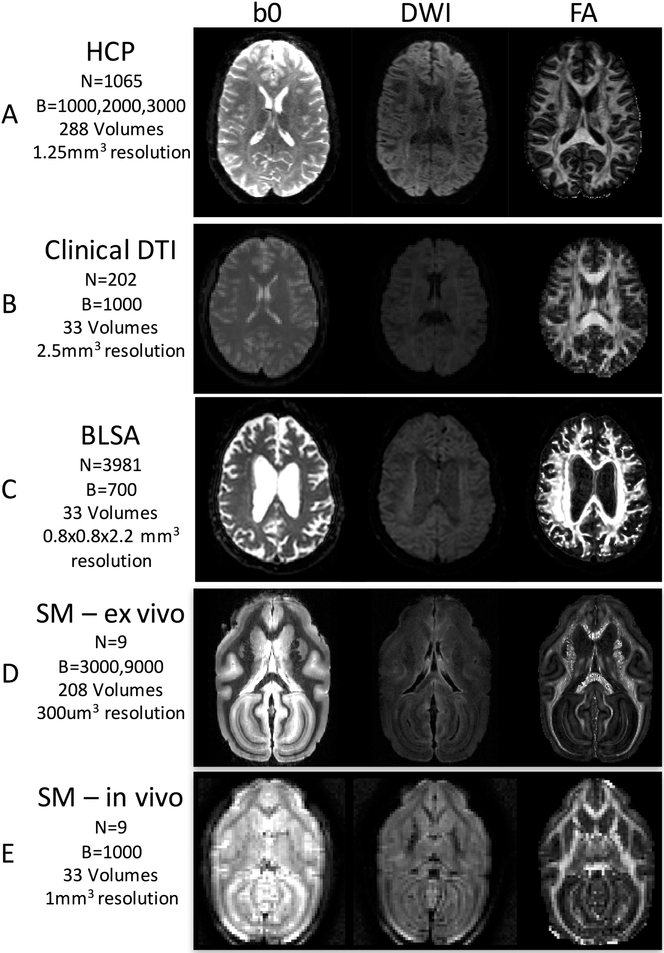
Methods: We define a "fiber coherence index" to describe how well fibers are connected to each other, and use it to automatically detect the correct configuration of b-vectors. We examined the performance on 3981 research subject scans (Baltimore Longitudinal Study of Aging), 1065 normal subject scans of high image quality (Human Connectome Project), and 202 patient scans (Vanderbilt University Medical Center), as well as 9 in-vivo and 9 ex-vivo animal data.

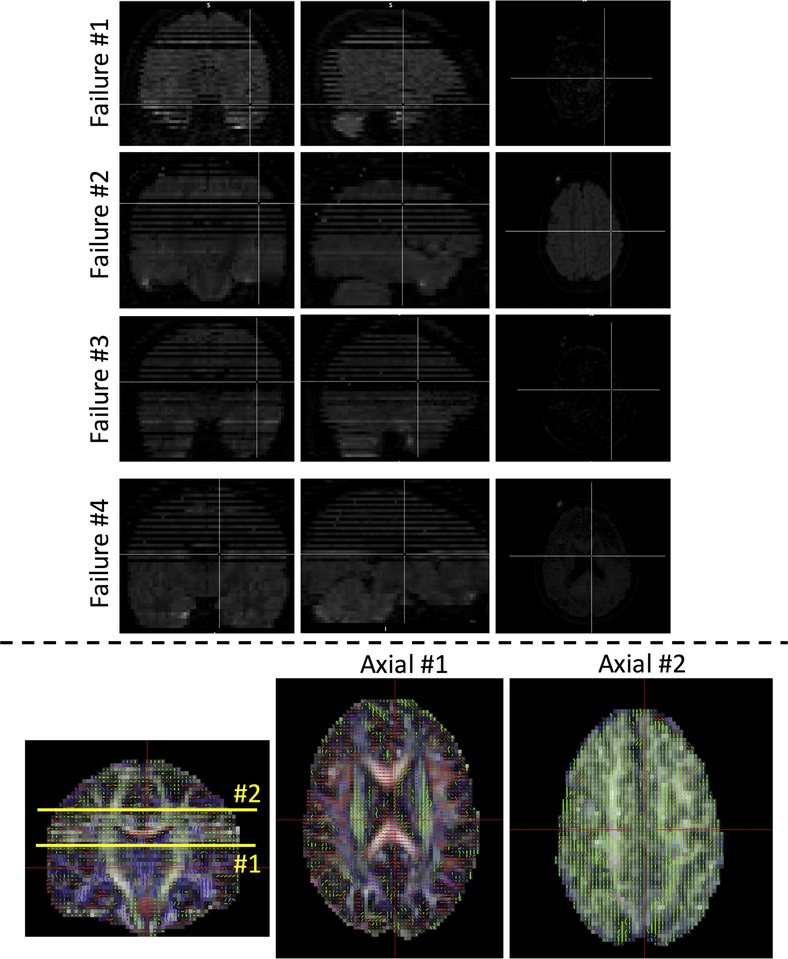
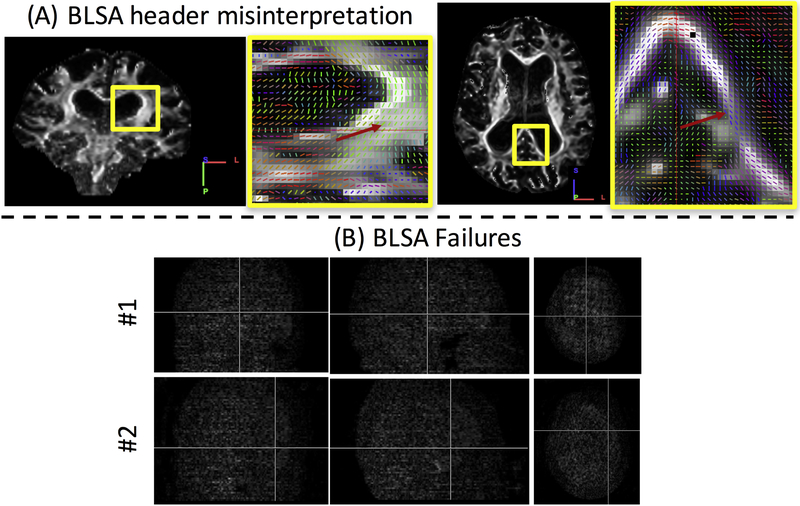
Results: The coherence index resulted in a 99.9% (3979/3981) and 100% (1065/1065) success rate in normal subject scans, 98% (198/202) in patient scans, and 100% (18/18) in both in-vivo and ex-vivo animal data in detecting the correct gradient table in datasets without severe image artifacts. The four failing cases (4/202) in patient scans, and two failures in healthy subject scans (2/3981), all showed prominent motion or signal dropout artifacts.

Conclusions: The fiber coherence measure can be used as an automatic quality assurance check in any diffusion analysis pipeline. Additionally, the success of this fiber coherence measure suggests potential broader applications, including evaluating data quality, or even providing diagnostic value as a biomarker of white matter integrity.

Keywords: B-table; Coherence; Diffusion MRI; Gradient; Orientation; White matter.


Figures

Figure 1.
Figure 1.
Effects of incorrect b-vector tables. Diffusion encoded color (DEC) maps and vector maps are shown for a correct gradient table (A), a table with a flipped component (B), and one with permuted components (C). With a flipped component, the DEC map may appear correct, but unit vectors will be flipped in one plane (coronal plane in this example), and will appear correct in another (axial). For a permuted table, both the color maps and vectors will be erroneous. In both (B) and (C), directions are incorrect, and subsequent analysis and tractography will also be erroneous. DEC and vector maps are colored red, green, and blue for diffusion primarily in the right/left, anterior/posterior, and superior/inferior directions, respectively.
Figure 2.
Figure 2.
Example images for each of the 4 tested datasets. We have chosen to validate the fiber coherence index as a quality assurance metric on high quality HCP data (A), clinical-quality patient DTI data (B), research subject BLSA data (C) high quality ex vivo squirrel monkey scans (E), and standard in vivo squirrel monkey acquisitions (E). For each, basic diffusion imaging parameters are given, and example b0, DWI, and FA images are shown to show large variability in image quality.
Figure 3.
Figure 3.
When the coherence index fails to correct gradient tables, image artifacts are always present. In this study, only 4 patient datasets had failures when correcting b-vectors, and all had slice dropout and subsequent reconstruction artifacts (top). In these cases, incorrect orientation estimates (bottom) were a result of signal dropout causing artificially increased coherence in a number of slices (see Axial slice #2).
Figure 4.
Figure 4.
Image orientation misinterpretation and gradient correction failures. For the BLSA data, 259 scans had a misinterpreted header with our initial code (A, note the incorrect orientation labels), however the index was able to find the correct vectors to match the image, where vectors are oriented appropriately, but the wrong color (red arrows). Only 2 datasets had failures of correcting b-vectors, both containing severe signal dropout and motion artifacts (B).

References

    1. Jones DK, Diffusion MRI: Theory, Methods, and Applications. (Oxford University Press, USA, 2010).
    1. Conturo TE et al., Tracking neuronal fiber pathways in the living human brain. Proceedings of the National Academy of Sciences of the United States of America 96, 10422–10427 (1999). - PMC - PubMed
    1. Mori S, Crain BJ, Chacko VP, van Zijl PC, Three-dimensional tracking of axonal projections in the brain by magnetic resonance imaging. Annals of neurology 45, 265–269 (1999). - PubMed
    1. Novikov DS, Fieremans E, Jespersen SN, Kiselev VG, Quantifying brain microstructure with diffusion MRI: Theory and parameter estimation. ArXiv e-prints. 2016. - PMC - PubMed
    1. Basser PJ, Mattiello J, LeBihan D, MR diffusion tensor spectroscopy and imaging. Biophysical Journal 66, 259–267 (1994). - PMC - PubMed

Publication types