

Vital Sign Monitoring and Cardiac Triggering at 1.5 Tesla: A Practical Solution by an MR-Ballistocardiography Fiber-Optic Sensor
- PMID: 30682784
- PMCID: PMC6386836
- DOI: 10.3390/s19030470
Vital Sign Monitoring and Cardiac Triggering at 1.5 Tesla: A Practical Solution by an MR-Ballistocardiography Fiber-Optic Sensor
Abstract
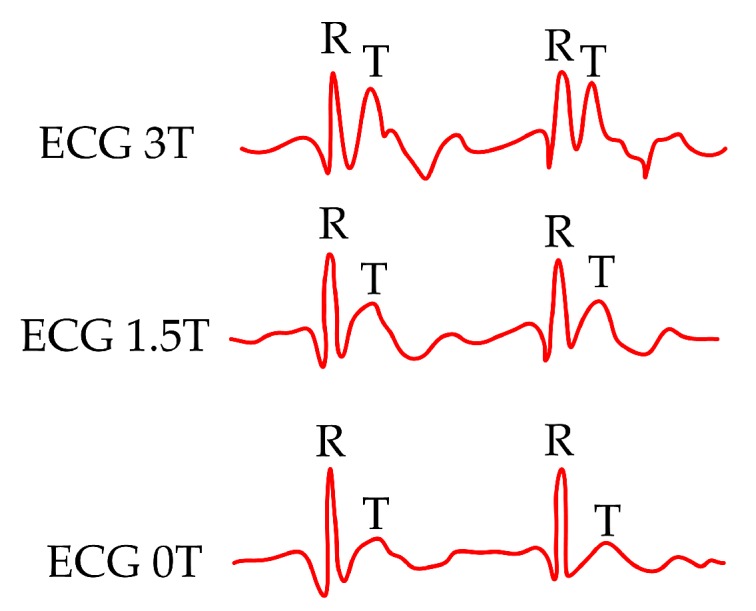
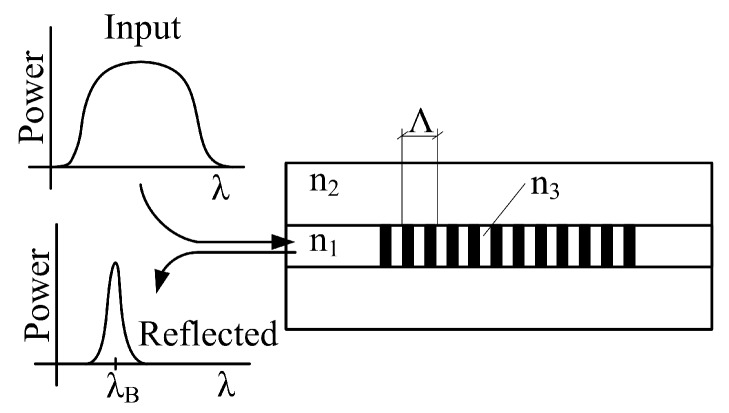
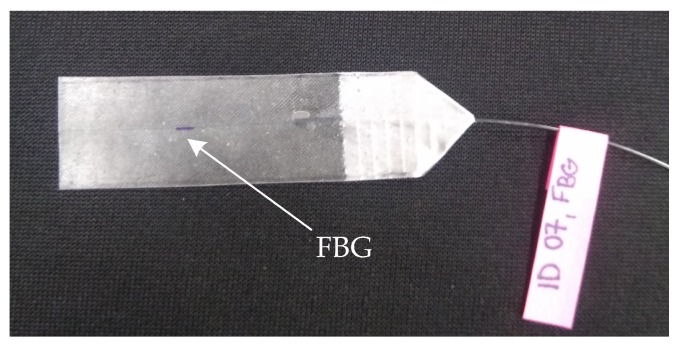
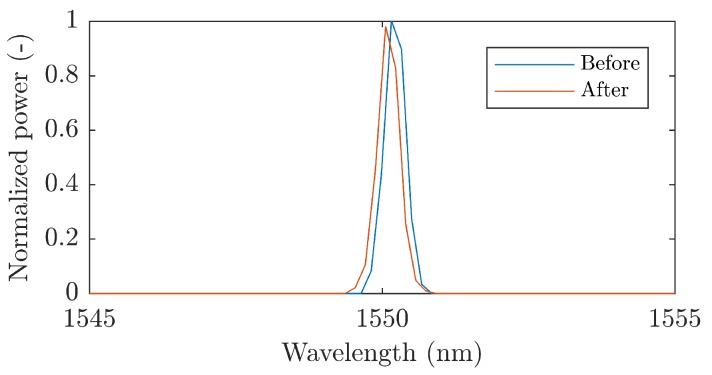
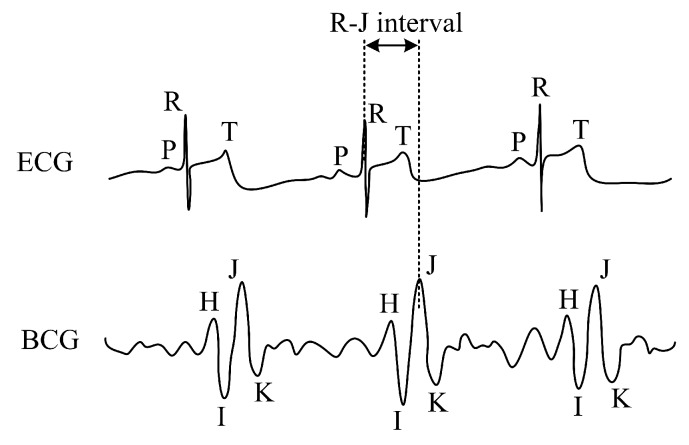
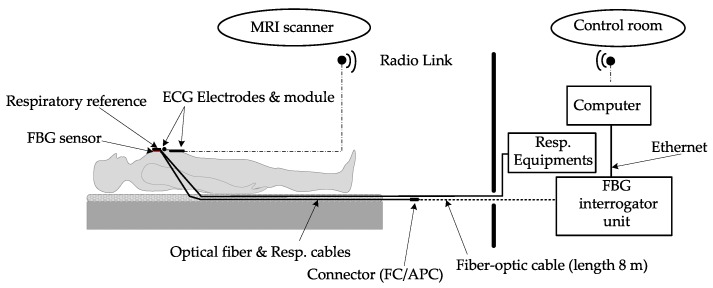
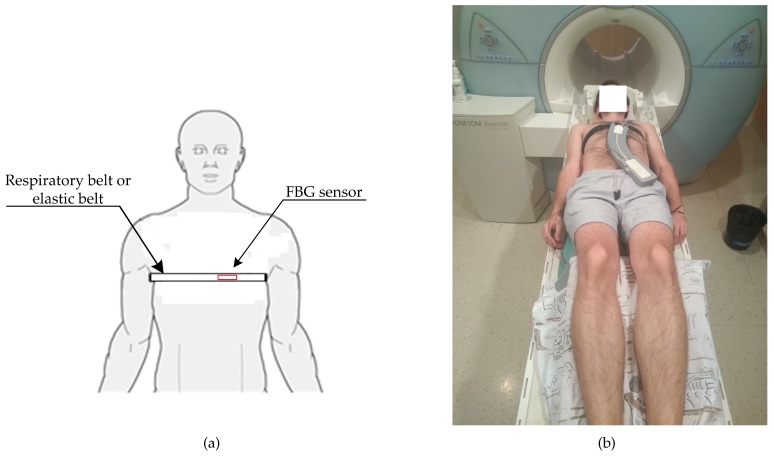
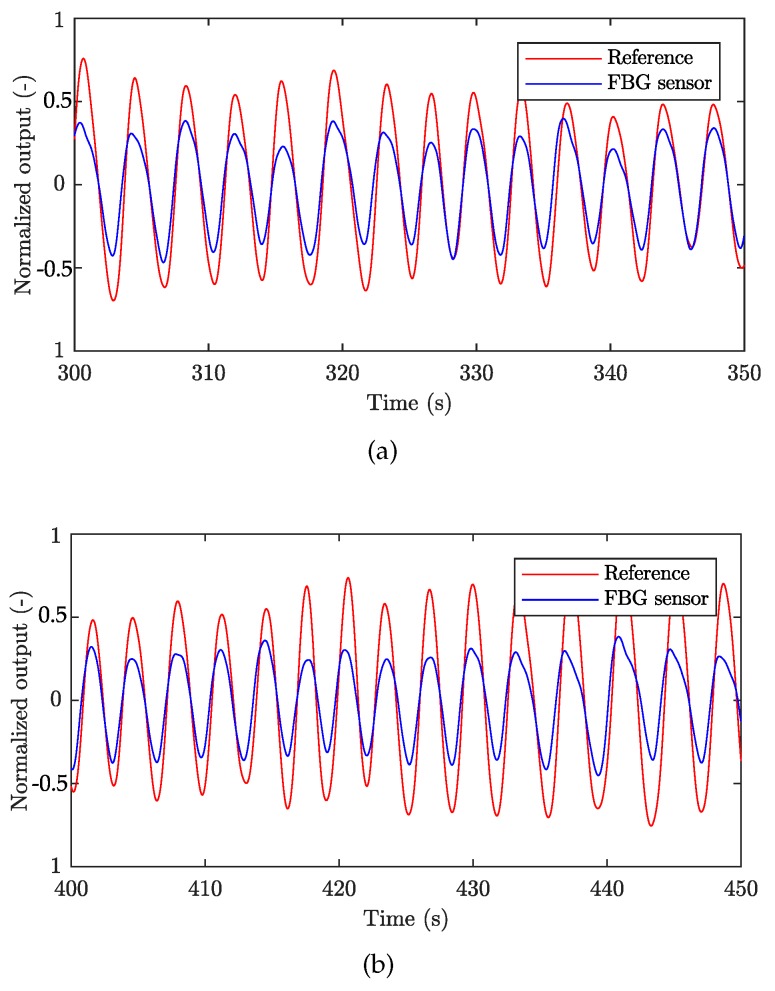
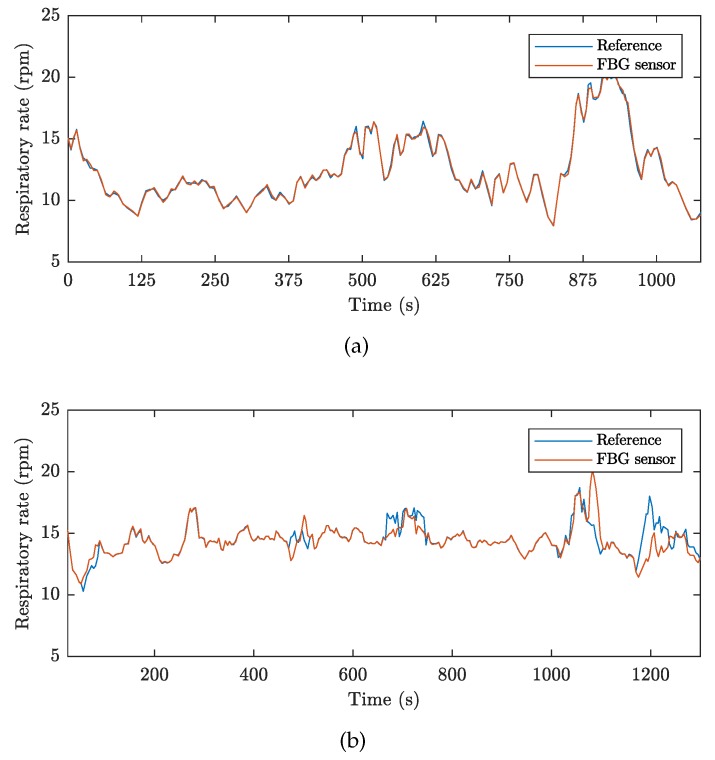
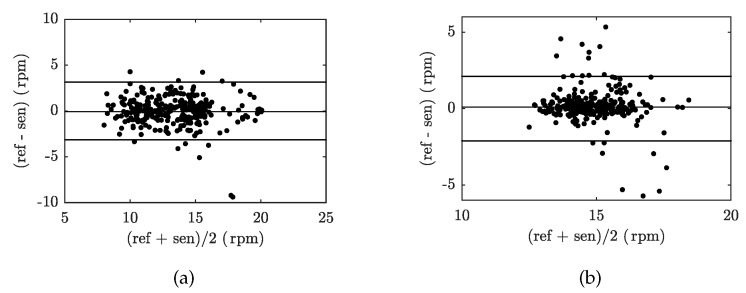
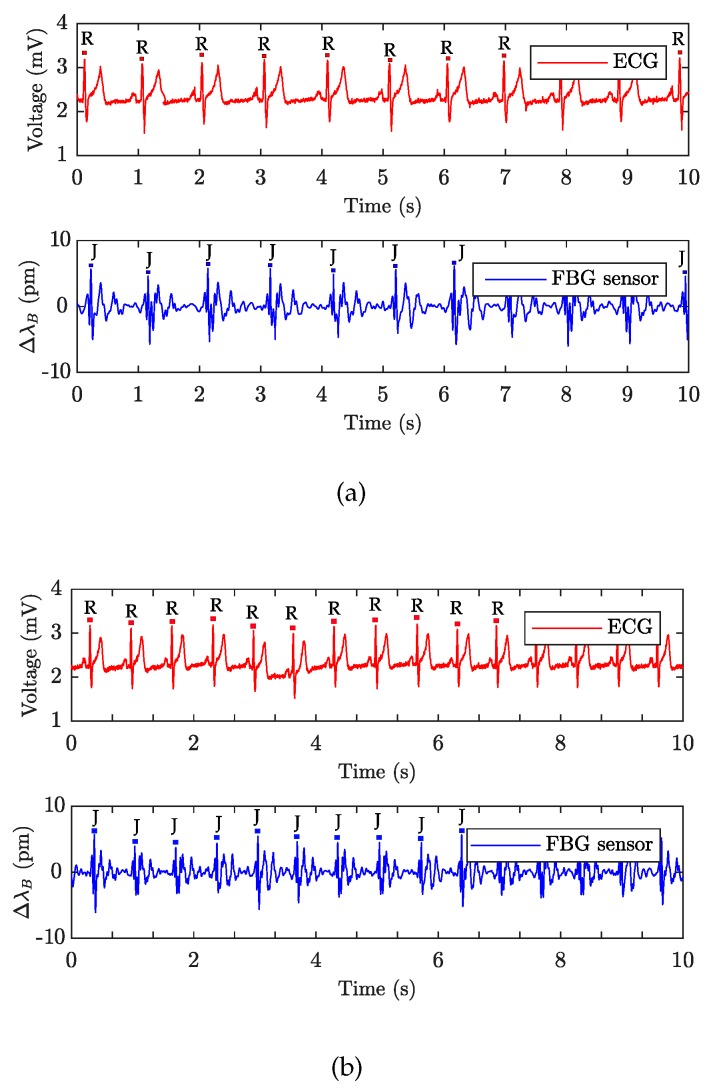
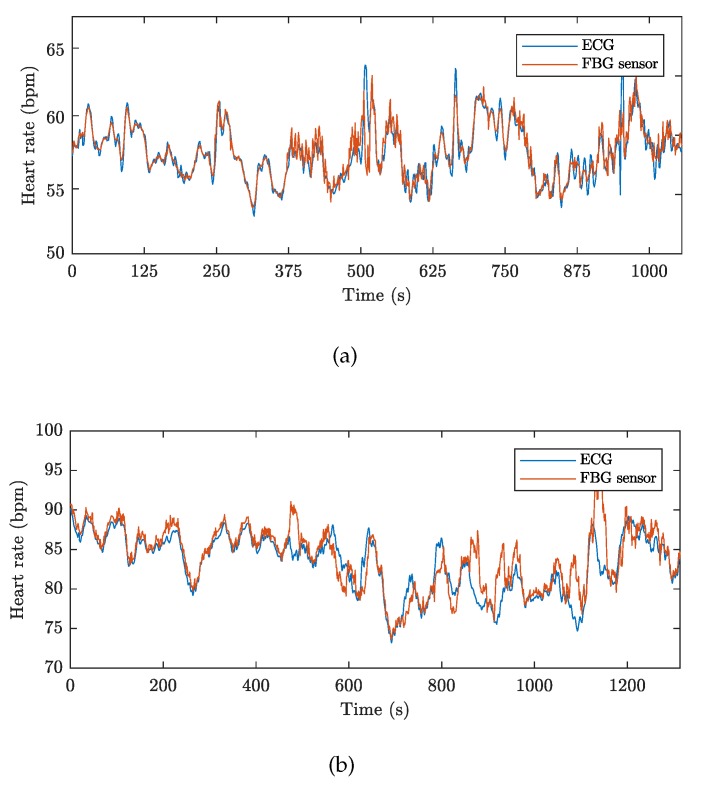
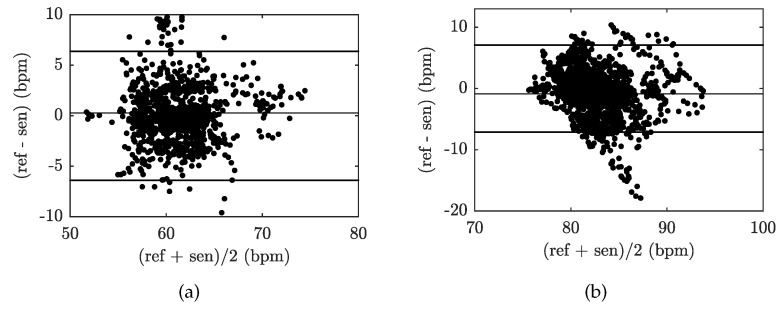
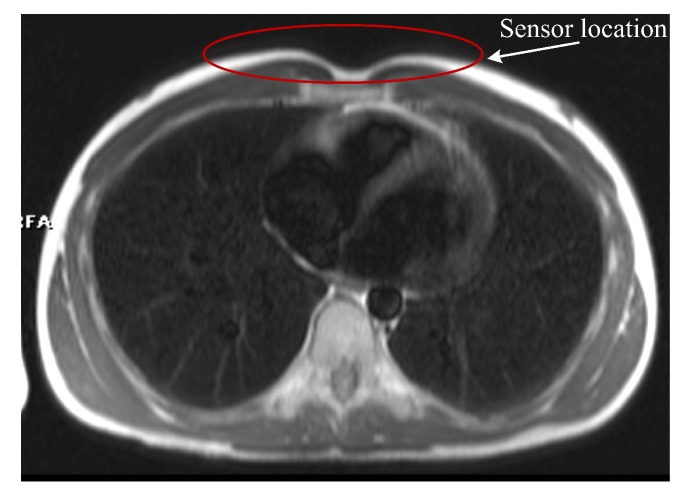
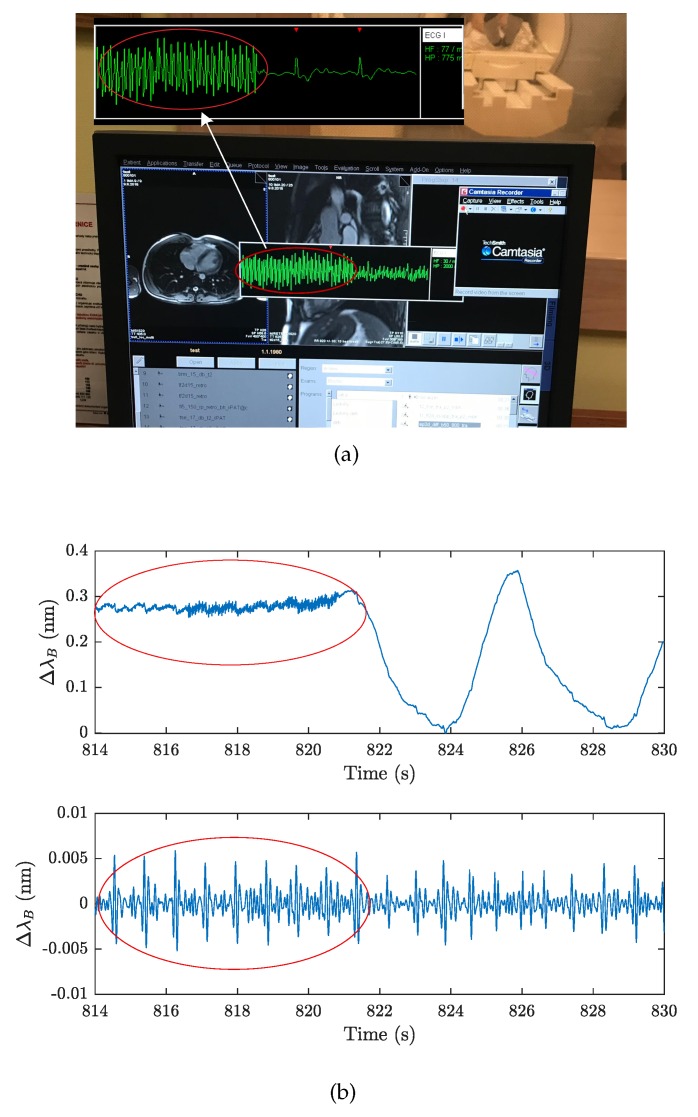
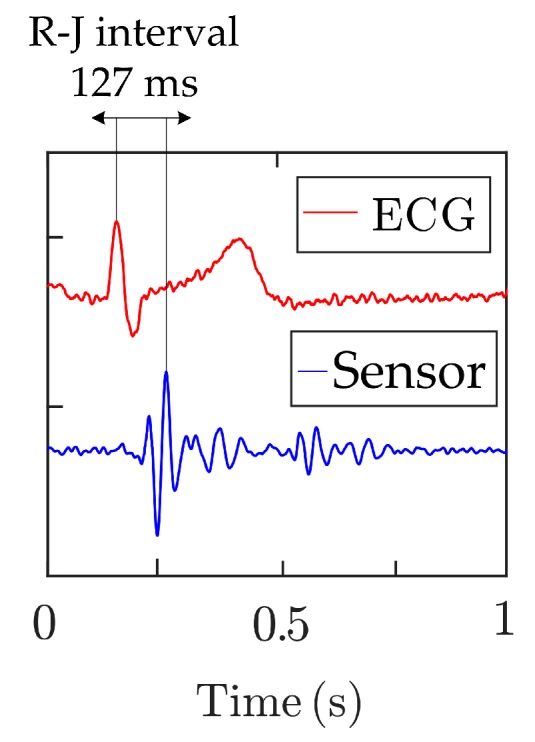
This article presents a solution for continuous monitoring of both respiratory rate (RR) and heart rate (HR) inside Magnetic Resonance Imaging (MRI) environments by a novel ballistocardiography (BCG) fiber-optic sensor. We designed and created a sensor based on the Fiber Bragg Grating (FBG) probe encapsulated inside fiberglass (fiberglass is a composite material made up of glass fiber, fabric, and cured synthetic resin). Due to this, the encapsulation sensor is characterized by very small dimensions (30 × 10 × 0.8 mm) and low weight (2 g). We present original results of real MRI measurements (conventionally most used 1.5 T MR scanner) involving ten volunteers (six men and four women) by performing conventional electrocardiography (ECG) to measure the HR and using a Pneumatic Respiratory Transducer (PRT) for RR monitoring. The acquired sensor data were compared against real measurements using the objective Bland⁻Altman method, and the functionality of the sensor was validated (95.36% of the sensed values were within the ±1.96 SD range for the RR determination and 95.13% of the values were within the ±1.96 SD range for the HR determination) by this means. The accuracy of this sensor was further characterized by a relative error below 5% (4.64% for RR and 4.87% for HR measurements). The tests carried out in an MRI environment demonstrated that the presence of the FBG sensor in the MRI scanner does not affect the quality of this imaging modality. The results also confirmed the possibility of using the sensor for cardiac triggering at 1.5 T (for synchronization and gating of cardiovascular magnetic resonance) and for cardiac triggering when a Diffusion Weighted Imaging (DWI) is used.
Keywords: MRI-compatible; ballistocardiography (BCG); cardiac triggering; fiber bragg grating (FBG); fiberglass; heart rate (HR); respiratory rate (RR).
Conflict of interest statement
The authors declare no conflicts of interest.
Figures

Similar articles
-
Magnetic Resonance Imaging Compatible Non-Invasive Fibre-Optic Sensors Based on the Bragg Gratings and Interferometers in the Application of Monitoring Heart and Respiration Rate of the Human Body: A Comparative Study.Sensors (Basel). 2018 Oct 31;18(11):3713. doi: 10.3390/s18113713. Sensors (Basel). 2018. PMID: 30384506 Free PMC article.
-
Simultaneous measurement of breathing rate and heart rate using a microbend multimode fiber optic sensor.J Biomed Opt. 2014 May;19(5):057001. doi: 10.1117/1.JBO.19.5.057001. J Biomed Opt. 2014. PMID: 24788372
-
A Non-Invasive Multichannel Hybrid Fiber-Optic Sensor System for Vital Sign Monitoring.Sensors (Basel). 2017 Jan 8;17(1):111. doi: 10.3390/s17010111. Sensors (Basel). 2017. PMID: 28075341 Free PMC article.
-
Investigating Cardiorespiratory Interaction Using Ballistocardiography and Seismocardiography-A Narrative Review.Sensors (Basel). 2022 Dec 6;22(23):9565. doi: 10.3390/s22239565. Sensors (Basel). 2022. PMID: 36502267 Free PMC article. Review.
-
Vital Sign Monitoring in Car Seats Based on Electrocardiography, Ballistocardiography and Seismocardiography: A Review.Sensors (Basel). 2020 Oct 6;20(19):5699. doi: 10.3390/s20195699. Sensors (Basel). 2020. PMID: 33036313 Free PMC article. Review.
Cited by
-
Drug selection for sedation and general anesthesia in children undergoing ambulatory magnetic resonance imaging.Yeungnam Univ J Med. 2020 Jul;37(3):159-168. doi: 10.12701/yujm.2020.00171. Epub 2020 Apr 17. Yeungnam Univ J Med. 2020. PMID: 32299181 Free PMC article.
-
Fiber Optic Sensors for Vital Signs Monitoring. A Review of Its Practicality in the Health Field.Biosensors (Basel). 2021 Feb 23;11(2):58. doi: 10.3390/bios11020058. Biosensors (Basel). 2021. PMID: 33672317 Free PMC article. Review.
-
Emerging Paradigms in Fetal Heart Rate Monitoring: Evaluating the Efficacy and Application of Innovative Textile-Based Wearables.Sensors (Basel). 2024 Sep 19;24(18):6066. doi: 10.3390/s24186066. Sensors (Basel). 2024. PMID: 39338811 Free PMC article. Review.
-
Deep learning-based method for the continuous detection of heart rate in signals from a multi-fiber Bragg grating sensor compatible with magnetic resonance imaging.Biomed Opt Express. 2021 Nov 24;12(12):7790-7806. doi: 10.1364/BOE.441932. eCollection 2021 Dec 1. Biomed Opt Express. 2021. PMID: 35003867 Free PMC article.
-
A Soft and Skin-Interfaced Smart Patch Based on Fiber Optics for Cardiorespiratory Monitoring.Biosensors (Basel). 2022 May 26;12(6):363. doi: 10.3390/bios12060363. Biosensors (Basel). 2022. PMID: 35735511 Free PMC article.
References
-
- Tamaki S., Yamada T., Okuyama Y., Morita T., Sanada S., Tsukamoto Y. Cardiac iodine-123 metaiodobenzylguanidine imaging predicts sudden cardiac death independently of left ventricular ejection fraction in patients with chronic heart failure and left ventricular systolic dysfunction: results from a comparative study with signal-averaged electrocardiogram, heart rate variability, and QT dispersion. J. Am. Coll. Cardiol. 2009;53:426–435. - PubMed
MeSH terms
Grants and funding
LinkOut - more resources
Full Text Sources
Other Literature Sources
