. 2019 Jan 24;8(2):30.
doi: 10.3390/plants8020030.

Evolutionary Analysis of GH3 Genes in Six Oryza Species/Subspecies and Their Expression under Salinity Stress in Oryza sativa ssp. japonica

Affiliations

Evolutionary Analysis of GH3 Genes in Six Oryza Species/Subspecies and Their Expression under Salinity Stress in Oryza sativa ssp. japonica

Weilong Kong et al. Plants (Basel). .

Abstract

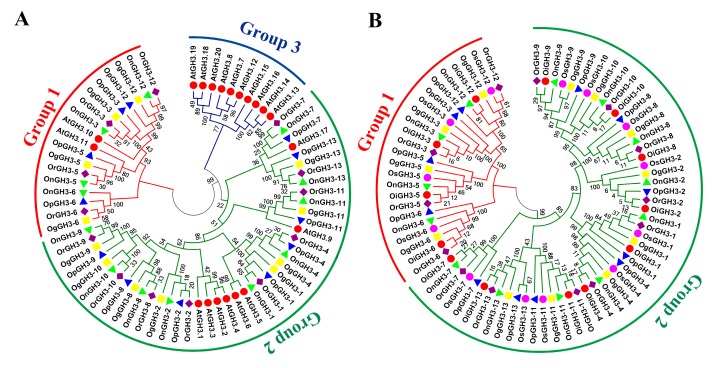
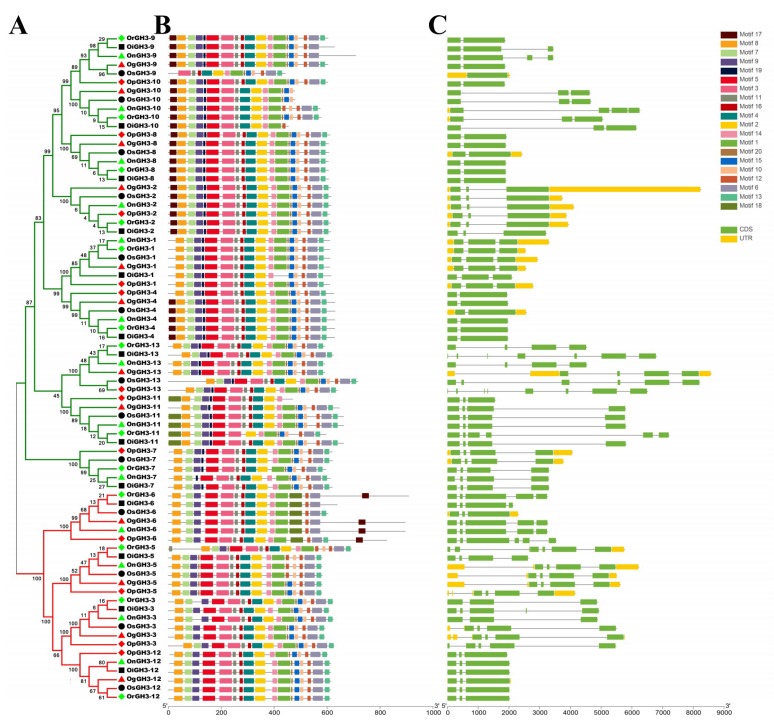
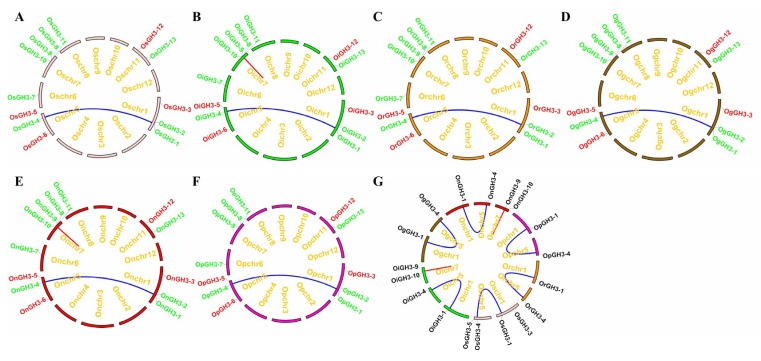
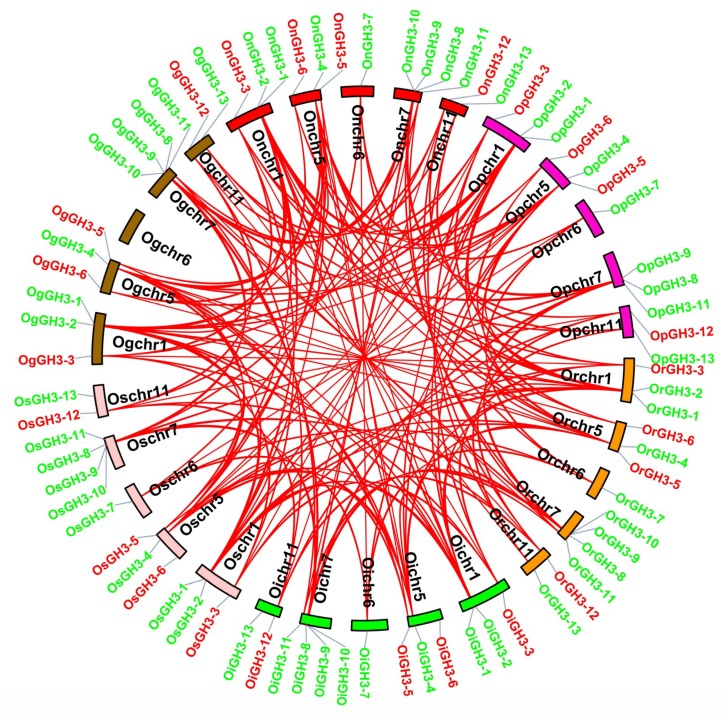
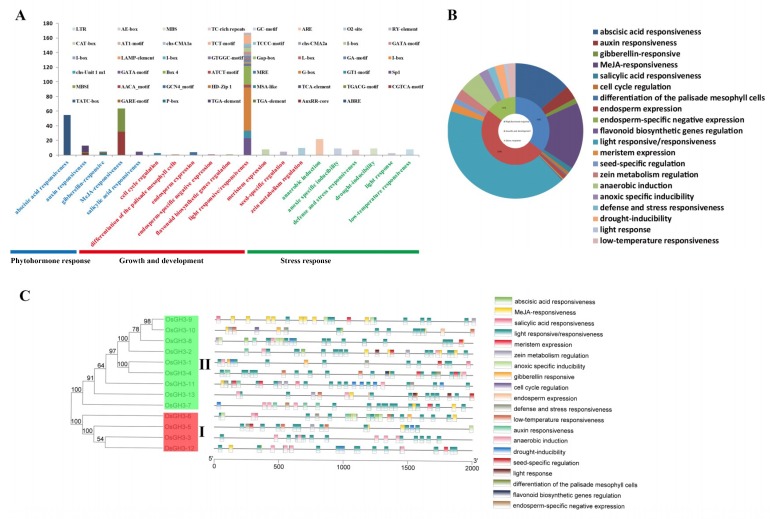
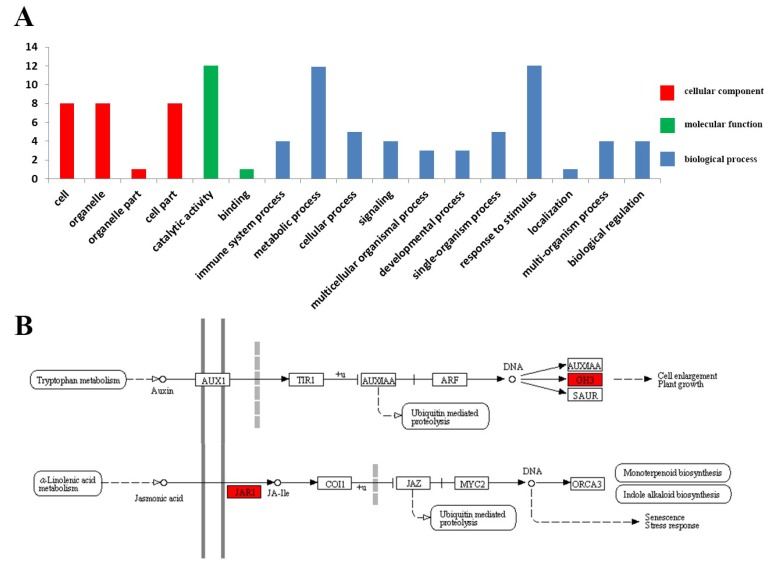
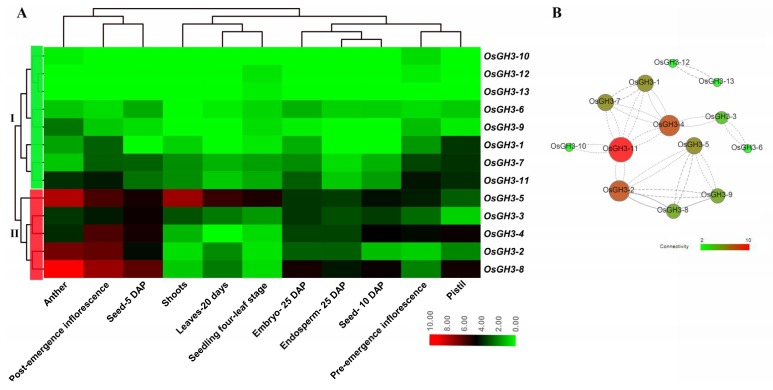
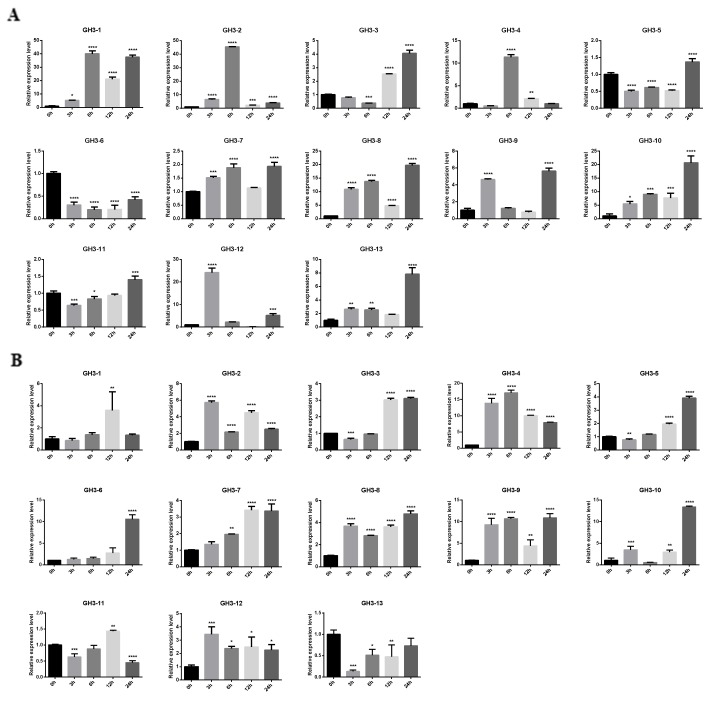
Glycoside Hydrolase 3 (GH3), a member of the Auxin-responsive gene family, is involved in plant growth, the plant developmental process, and various stress responses. The GH3 gene family has been well-studied in Arabidopsis thaliana and Zea mays. However, the evolution of the GH3 gene family in Oryza species remains unknown and the function of the GH3 gene family in Oryza sativa is not well-documented. Here, a systematic analysis was performed in six Oryza species/subspecies, including four wild rice species and two cultivated rice subspecies. A total of 13, 13, 13, 13, 12, and 12 members were identified in O. sativa ssp. japonica, O. sativa ssp. indica, Oryza rufipogon, Oryza nivara, Oryza punctata, and Oryza glumaepatula, respectively. Gene duplication events, structural features, conserved motifs, a phylogenetic analysis, chromosome locations, and Ka/Ks ratios of this important family were found to be strictly conservative across these six Oryza species/subspecies, suggesting that the expansion of the GH3 gene family in Oryza species might be attributed to duplication events, and this expansion could occur in the common ancestor of Oryza species, even in common ancestor of rice tribe (Oryzeae) (23.07~31.01 Mya). The RNA-seq results of different tissues displayed that OsGH3 genes had significantly different expression profiles. Remarkably, the qRT-PCR result after NaCl treatment indicated that the majority of OsGH3 genes play important roles in salinity stress, especially OsGH3-2 and OsGH3-8. This study provides important insights into the evolution of the GH3 gene family in Oryza species and will assist with further investigation of OsGH3 genes' functions under salinity stress.

Keywords: GH3, salinity stress; Oryza species; RNA-seq; gene duplication; qRT-PCR; rice.


Conflict of interest statement

The authors declare no conflict of interest.

Figures

Figure 1
Figure 1
(A) A phylogenetic tree of GH3 protein sequences from five Oryza species and Arabidopsis. (B) A phylogenetic tree of GH3 protein sequences from six Oryza species/subspecies. Clustal W is used for multiple sequence alignment. MEGA 6.0 is adopted for phylogenetic reconstruction by using the Neighbor Joining (NJ) clustering method. Bootstrap numbers (1000 replicates) are shown. Different colors of circles represent different subfamilies. The different species are indicated by different shaped markers.
Figure 2
Figure 2
The phylogenetic tree (A), motif compositions (B), and exon/intron structure (C) of the GH3 genes in six Oryza species/subspecies. (A) Sequence alignments and the NJ-Phylogenetic trees were made using ClustalW and MEGA 6.0, respectively. A bootstrap number (1000 replicates) is adopted. The red and green colors in the phylogenetic tree represent group1 and group2, respectively. (B,C) The widths of the grey bars represent the relative lengths of genes and proteins. The green boxes and grey lines display exons and introns, respectively.
Figure 3
Figure 3
The chromosome location and duplication events of GH3 genes in six species/subspecies (A–F), and duplication events in six Oryza species/subspecies (G). Os represents Oryza sativa ssp. japonica. Oi represents Oryza sativa ssp. indica. Or represents Oryza rufipogon. On represents Oryza nivara. Op represents Oryza punctata. Og represents Oryza glumaepatula. The chromosomes of different Oryza species/subspecies are shown by different colors. The location of each GH3 gene is marked with a grey line using Circos software. The whole genome duplication (WGD) or segmental duplication/Tandem duplication gene pairs are linked by blue/red lines. The red and green genes in A–F belong to group1 and group2, respectively.
Figure 4
Figure 4
The collinear gene pairs across six Oryza species/subspecies. The chromosome colors and abbreviations of species are the same as in Figure 3. The red lines represent collinear gene pairs.
Figure 5
Figure 5
Identification of cis-acting elements in all GH3 genes of Oryza sativa ssp. japonica. (A) The different bars represent different primary categories, the different characters represent different secondary categories, and the different colors in histograms represent the number of different promoter elements in each secondary category. (B) Pie charts of different sizes indicate the ratio of each primary/secondary category. (C) The different groups of GH3 genes in the phylogenetic tree are shown by different colors. The differently colored boxes represent the different secondary categories.
Figure 6
Figure 6
Gene ontology classification and KEGG pathway annotation of OsGH3 genes. (A) The Y-axis indicates the actual gene number and the X-axis indicates three categories (cellular component, molecular function, and biological process). (B) The OsGH3-gene-related KEGG pathways are marked in red.
Figure 7
Figure 7
Expression profiles of OsGH3 genes in different tissues (A) and a co-expression network diagram of OsGH3 genes in different tissues. (A) The color scale at the bottom of the image represents log2FPKM; red indicates a high level; and green represents a low level of transcript abundance. (B) The Correlation from weak to strong is shown by dotted line to solid line. Connectivity from weak to strong is shown from green to red. DAP, days after pollination.
Figure 8
Figure 8
The expression pattern of the 13 OsGH3 genes in ‘Nipponbare’ seedling leaf (A) and root (B) after NaCl treatment for 0 h, 3 h, 6 h, 12 h, and 24 h. The 2−ΔΔCT method was adopted to calculate the fold change of OsGH3 gene expression from three biological replicates. The error bars show the standard deviations of the three independent qRT-PCR biological replicates. * represents a significant difference relative to the 0 h group (p < 0.05).

References

    1. Woodward A.W., Bartel B. Auxin: Regulation, action, and interaction. Ann. Bot. 2005;95:707–735. doi: 10.1093/aob/mci083. - DOI - PMC - PubMed
    1. Baranwal V., Negi N., Khurana P. Auxin response factor genes repertoire in mulberry: Identification, and structural, functional and evolutionary analyses. Genes. 2017;8:202. doi: 10.3390/genes8090202. - DOI - PMC - PubMed
    1. Chen Y., Xi H., Cao J. Small auxin upregulated RNA (SAUR) gene family in maize: Identification, evolution, and its phylogenetic comparison with Arabidopsis, rice, and sorghum. J. Integr. Plant Biol. 2014;56:133–150. doi: 10.1111/jipb.12127. - DOI - PubMed
    1. Hagen G., Kleinschmidt A., Guilfoyle T. Auxin-regulated gene expression in intact soybean hypocotyl and excised hypocotyl sections. Planta. 1984;162:147–153. doi: 10.1007/BF00410211. - DOI - PubMed
    1. Staswick P.E., Tiryaki I., Rowe M.L. Jasmonate response locus JAR1 and several related Arabidopsis genes encode enzymes of the firefly luciferase superfamily that show activity on Jasmonic, Salicylic, and Indole-3-acetic acids in an assay for adenylation. Plant Cell. 2002;14:1405–1415. doi: 10.1105/tpc.000885. - DOI - PMC - PubMed

LinkOut - more resources