. 2019 Mar 6;101(5):950-962.e7.
doi: 10.1016/j.neuron.2018.12.030. Epub 2019 Jan 22.

Structured Odorant Response Patterns across a Complete Olfactory Receptor Neuron Population

Affiliations

Structured Odorant Response Patterns across a Complete Olfactory Receptor Neuron Population

Guangwei Si et al. Neuron. .

Abstract

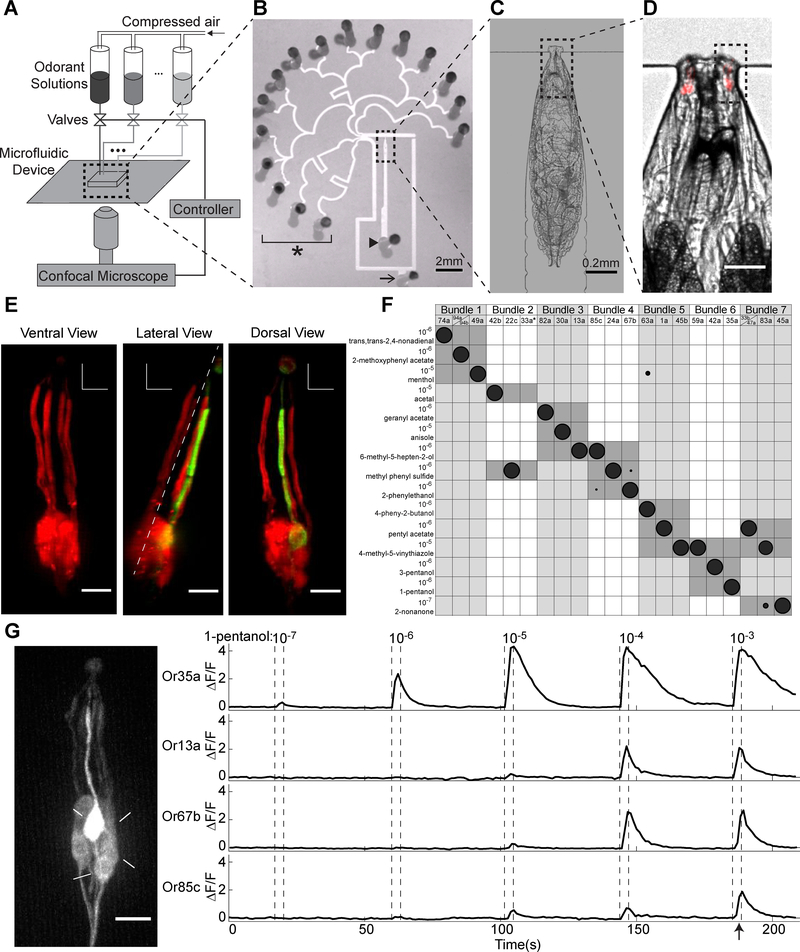
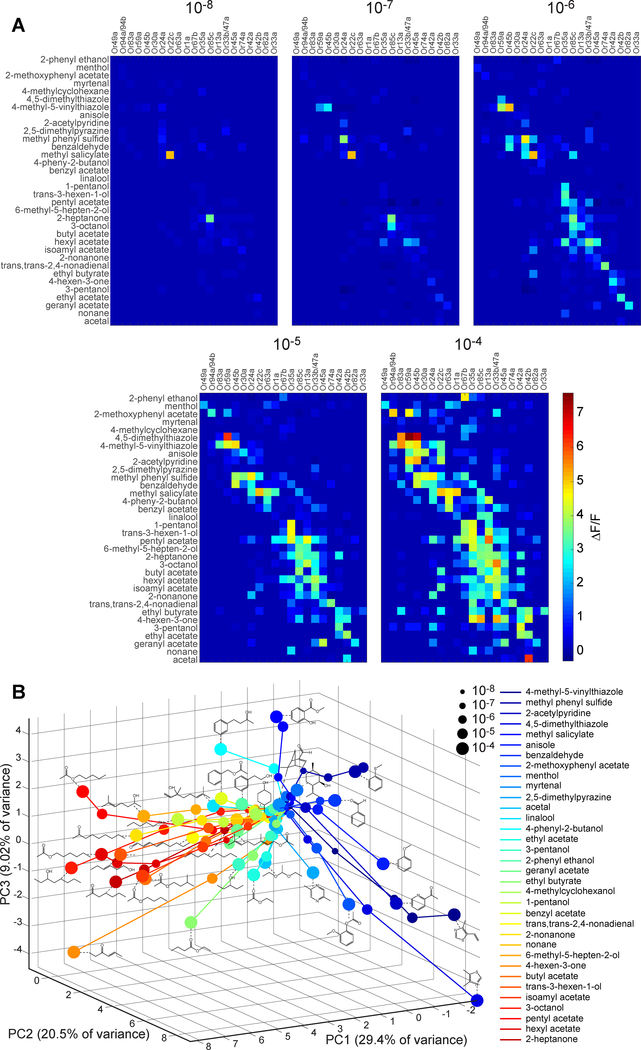
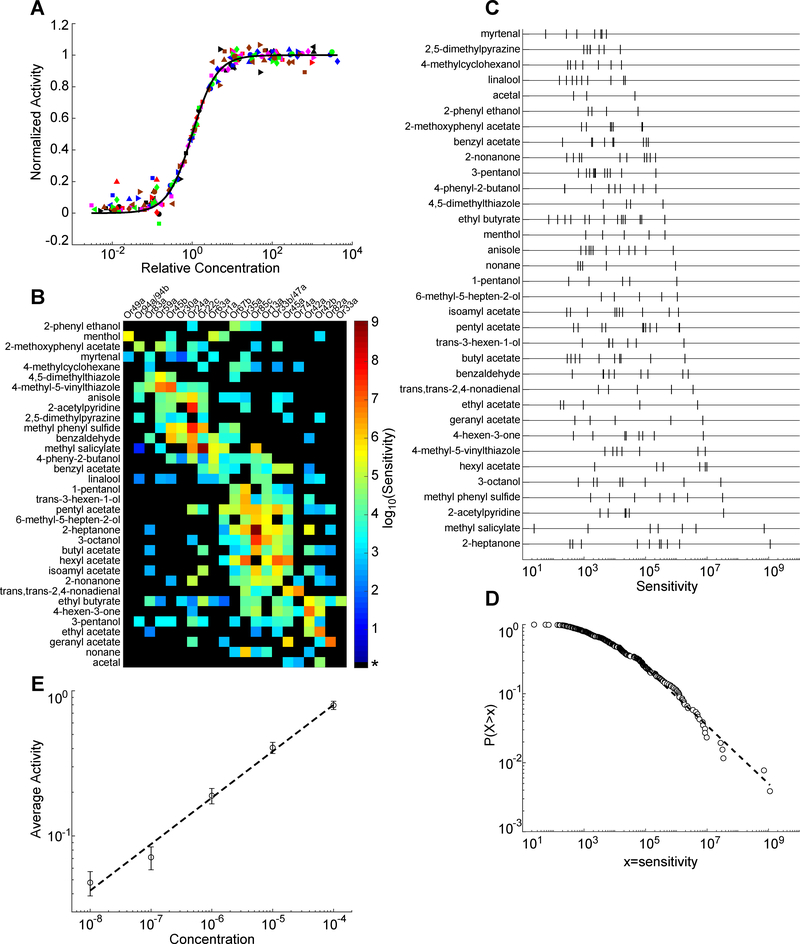
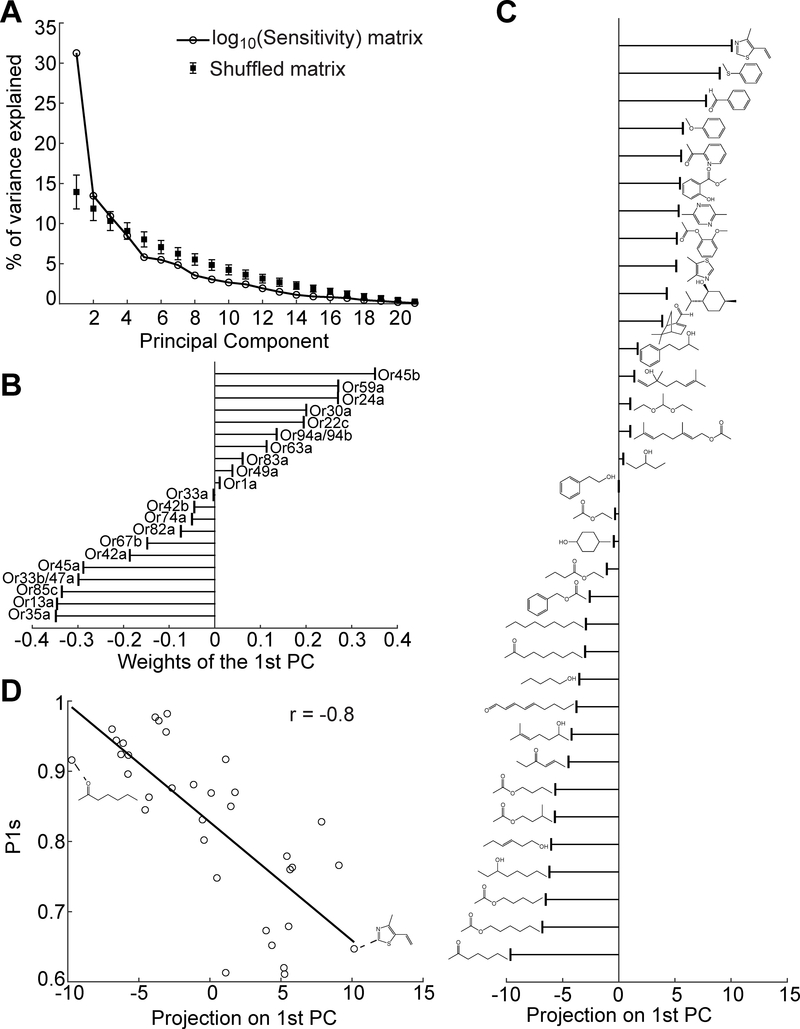
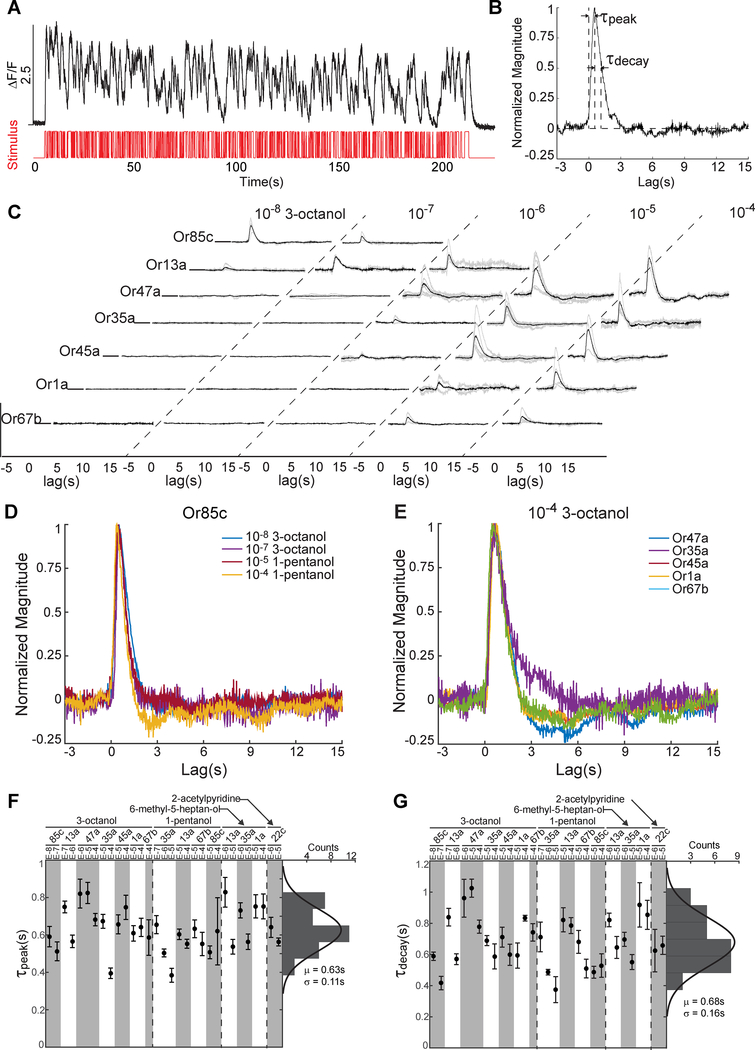
Odor perception allows animals to distinguish odors, recognize the same odor across concentrations, and determine concentration changes. How the activity patterns of primary olfactory receptor neurons (ORNs), at the individual and population levels, facilitate distinguishing these functions remains poorly understood. Here, we interrogate the complete ORN population of the Drosophila larva across a broadly sampled panel of odorants at varying concentrations. We find that the activity of each ORN scales with the concentration of any odorant via a fixed dose-response function with a variable sensitivity. Sensitivities across odorants and ORNs follow a power-law distribution. Much of receptor sensitivity to odorants is accounted for by a single geometrical property of molecular structure. Similarity in the shape of temporal response filters across odorants and ORNs extend these relationships to fluctuating environments. These results uncover shared individual- and population-level patterns that together lend structure to support odor perceptions.

Keywords: Drosophila; calcium imaging; combinatorial olfactory code; dose response relationship; microfluidics; molecular recognition; olfactory receptor neurons; power lab distribution; receptor sensitivity; temporal filter.


Conflict of interest statement

Declaration of Interests

The authors declare no competing interests.

Figures

Figure 1.
Figure 1.. Anatomical and functional identification of individual ORNs within the complete population.
(A) Schematic of the microfluidic setup for odorant delivery and larval ORN calcium imaging. (B) 16-channel microfluidic chip. Arrowhead marks inlet channel for loading a larva, arrow marks outlet channel for fluid waste, and * marks odorant stimuli delivery channels. (C-D) Magnified views (10X in C and 40X in D) of an immobilized larva in the inlet channel. Red indicates RFP labeling of all ORN dendrites and cell bodies. (E) Organization of the seven ORN dendritic bundles (numbered) in the larva. Or35a>GFP; Orco>RFP used to label all ORNs in red and the Or35a-ORN in green. Dashed line in lateral view marks separation between ventral and dorsal bundles. (F) Functional mapping between each of 15 odorants that primarily activate a single ORN within each dendritic bundle, at low concentrations. Size of shaded circles indicates normalized neural activity level (ΔF/F) of the specified ORN to an odorant. * indicates inferred location of the Or33a-ORN based on dendritic bundle 2 vacancy (Figure S2). (G) DOG cell body locations and GCaMP6m responses of four ORNs responsive to 1-pentanol (left). Fluorescence intensity changes for each of the four ORN cell bodies during pulsed presentations of increasing 1-pentanol concentrations (right). Arrow indicates time point at which left panel in G was captured. See also Figure S1, Figure S2 and Video S1.
Figure 2.
Figure 2.. Orthogonality of odorant identity and intensity in ORN population activity.
(A) Averaged peak responses of all 21 ORNs to a panel of 34 odorants, each delivered at five concentrations (n ≥ 5 for each odorant type and concentration; odorant pulse duration = 5 s). (B) PCA of ORN population responses. Colored dots represent the projection of ORN population activity onto the first three principal components. Size and color of dots correspond to odorant concentration and type, respectively. Dots from the same odorant are linked and the molecular structure of the odorant is shown adjacent to each trajectory. Aromatic versus aliphatic odorants cluster in separate regions of PCA space. See also Figure S3, Table S1 and Data S1.
Figure 3.
Figure 3.. Individual ORNs share a common activation function and population sensitivities follow a power law distribution.
(A) Normalized ORN responses across relative odorant concentration (actual concentration divided by EC50), for odorant-ORN pairs reaching saturation. Individual curves for plotted odorant-ORN pairs collapse onto a single curve described by a Hill equation with a shared Hill coefficient of 1.42. Black line indicates the Hill equation fit. Each distinct colored and shaped point represents data from an unique odorant-ORN pair. (B) Heatmap of the logarithm of sensitivity values, log10(1/EC50), from each odorant-ORN pair. * for black elements indicates odorant-ORN pairs that had no response within the tested concentration range. (C) Raster plot of ORN sensitivities (defined as 1/EC50) for each odorant. Each tick mark represents an ORN. (D) Log-log plot of the cumulative distribution function of ORN sensitivities across all odorants. Dashed line is a linear fit to the data with slope = −0.42. (E) Log-log plot of average neuron activity (ΔF/F) across all odorant-ORN pairs for each concentration. Error bars = SEM. Slope of least-squares fit line = 0.32 ± 0.06 (R2 = 0.99). See also Figure S4 and Table S2.
Figure 4.
Figure 4.. Correlation between ORN-odorant sensitivities and odorant molecular structure.
(A) Percentage of variance explained by each principal component of the ORN sensitivity matrix in Figure 3B. Data compared with the results from 1000 randomly shuffled matrices. (B) Weights indicating each ORN’s contribution to the 1st principal component. (C) Each odorant’s (indicated by molecular structure) projection onto the 1st principal component. (D) Correlation between each odorant’s projection on the 1st principal component and the most correlated molecular descriptor, P1s.
Figure 5.
Figure 5.. Common temporal signal processing across ORNs.
(A) Or42a-ORN response to an m-sequence delivery of 3-pentanol at 10−7 dilution. Red indicates on-off stimulus sequence over time and black curve indicates ORN response. (B) Linear filter calculated via reverse-correlation analysis from the data shown in A. (C) Linear filters of seven ORNs responding to 3-octanol across five concentrations. Black curve indicates the averaged filter from data across multiple animals (individual filters shown in gray). (D-E) Comparison of filter waveforms for the same odorant (10−4 dilution of 3-octanol) activating different ORNs (D), and the same ORN (Or85c) responding to different odorants and concentrations (E). All filters were normalized by their peak amplitude. (F-G) Distribution of peak time (F) and decay time (G) of 31 averaged filters measured from various ORN and odorant stimuli. Distributions of peak and decay times were fit to Gaussian distributions with mean and variance indicated below each histogram. See also Figure S5 and Video S2.

Comment in

References

    1. Andersson MN, Schlyter F, Hill SR, and Dekker T (2012). What Reaches the Antenna? How to Calibrate Odor Flux and Ligand - Receptor Affinities. Chem. Senses 37, 403–420. - PubMed
    1. Apostolopoulou AA, Widmann A, Rohwedder A, Pfitzenmaier JE, and Thum AS (2013). Appetitive Associative Olfactory Learning in Drosophila Larvae. J. Vis. Exp 1–11. - PMC - PubMed
    1. Asahina K, Louis M, Piccinotti S, and Vosshall LB (2009). A circuit supporting concentration-invariant odor perception in Drosophila. J. Biol 8, 9. - PMC - PubMed
    1. Berck ME, Khandelwal A, Claus L, Hernandez-Nunez L, Si G, Tabone CJ, Li F, Truman JW, Fetter RD, Louis M, et al. (2016). The wiring diagram of a glomerular olfactory system. Elife 5, 1–21. - PMC - PubMed
    1. Bolding KA, and Franks KM (2017). Complementary codes for odor identity and intensity in olfactory cortex. Elife 6, 1–26. - PMC - PubMed

Publication types

Substances

LinkOut - more resources