. 2019 Feb 12;116(7):2733-2742.
doi: 10.1073/pnas.1816456116. Epub 2019 Jan 25.

REM sleep's unique associations with corticosterone regulation, apoptotic pathways, and behavior in chronic stress in mice

Affiliations

REM sleep's unique associations with corticosterone regulation, apoptotic pathways, and behavior in chronic stress in mice

Mathieu Nollet et al. Proc Natl Acad Sci U S A. .

Abstract

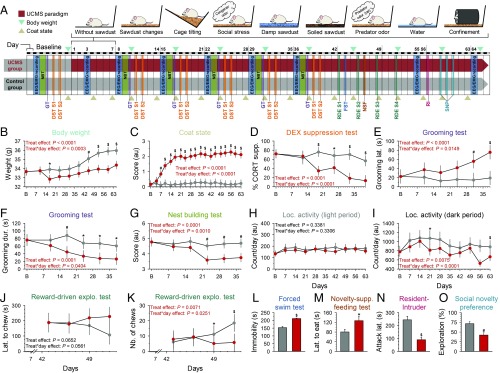
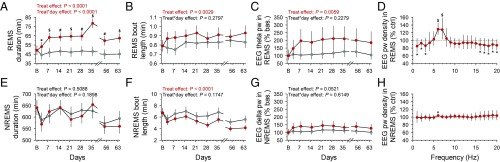
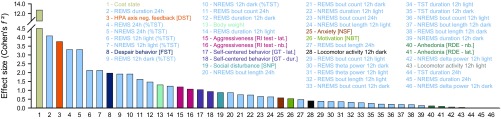
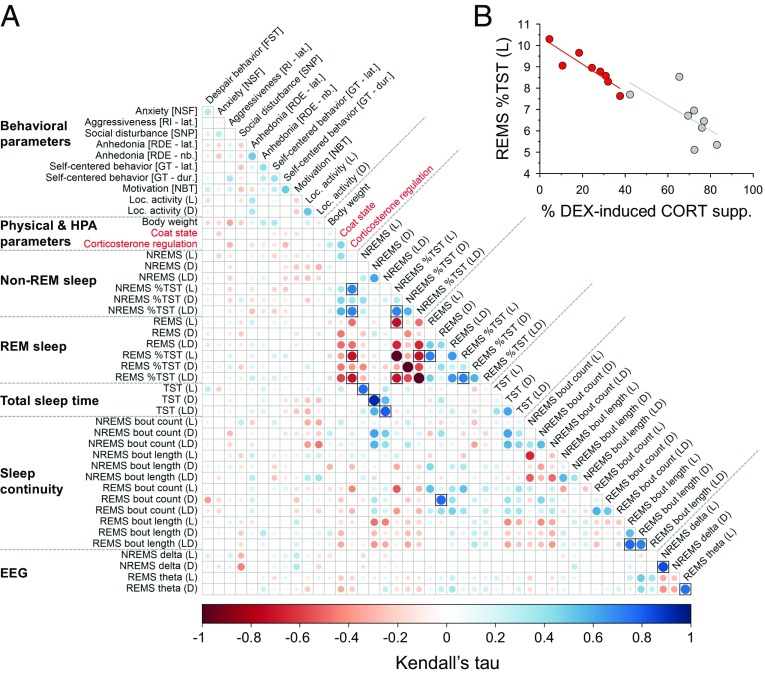
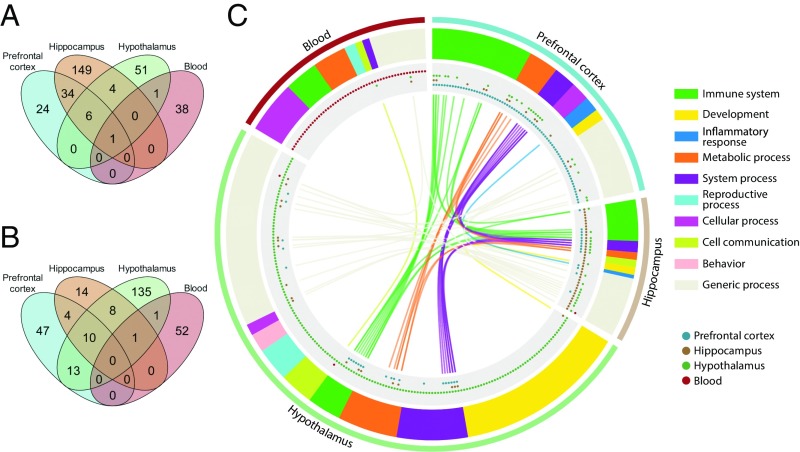
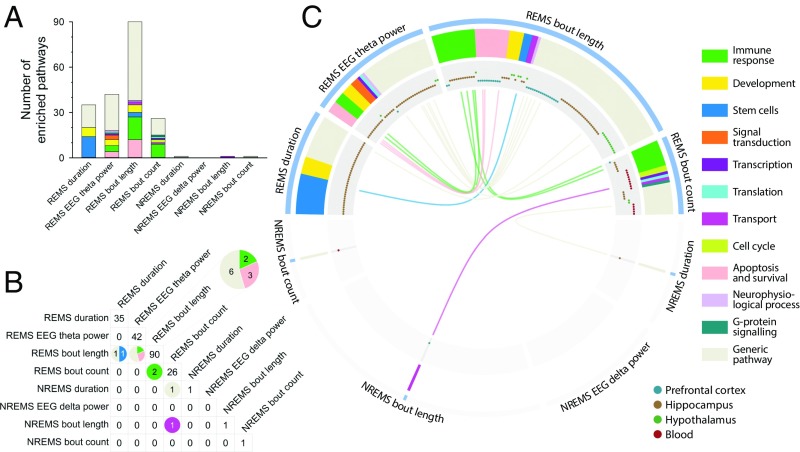
One of sleep's putative functions is mediation of adaptation to waking experiences. Chronic stress is a common waking experience; however, which specific aspect of sleep is most responsive, and how sleep changes relate to behavioral disturbances and molecular correlates remain unknown. We quantified sleep, physical, endocrine, and behavioral variables, as well as the brain and blood transcriptome in mice exposed to 9 weeks of unpredictable chronic mild stress (UCMS). Comparing 46 phenotypic variables revealed that rapid-eye-movement sleep (REMS), corticosterone regulation, and coat state were most responsive to UCMS. REMS theta oscillations were enhanced, whereas delta oscillations in non-REMS were unaffected. Transcripts affected by UCMS in the prefrontal cortex, hippocampus, hypothalamus, and blood were associated with inflammatory and immune responses. A machine-learning approach controlling for unspecific UCMS effects identified transcriptomic predictor sets for REMS parameters that were enriched in 193 pathways, including some involved in stem cells, immune response, and apoptosis and survival. Only three pathways were enriched in predictor sets for non-REMS. Transcriptomic predictor sets for variation in REMS continuity and theta activity shared many pathways with corticosterone regulation, in particular pathways implicated in apoptosis and survival, including mitochondrial apoptotic machinery. Predictor sets for REMS and anhedonia shared pathways involved in oxidative stress, cell proliferation, and apoptosis. These data identify REMS as a core and early element of the response to chronic stress, and identify apoptosis and survival pathways as a putative mechanism by which REMS may mediate the response to stressful waking experiences.

Keywords: EEG theta power; anhedonia; depression; machine learning; transcriptome.


Conflict of interest statement

Conflict of interest statement: This study was supported by a Lilly Innovation Fellowship Award (to M.N.) and conducted through an academic–industrial partnership between the Surrey Sleep Research Centre of the University of Surrey and Eli Lilly and Company Ltd. K.A.W., A.P.M., K.M., N.L., and M.N. were full-time employees of Eli Lilly and Company Ltd. at the time of the study. D.-J.D. has received research funds and acted as consultant to Eli Lilly and other pharmaceutical companies. R.W.-S. has received research funding from Eli Lilly.

Figures

Fig. 1.
Fig. 1.
UCMS protocol and physical, corticosterone regulation, and behavioral alterations. (A) Overview of the protocol. Mice were randomly assigned to the control (gray) or the UCMS (red) group. (B) Body weight, (C) coat state, (D) HPA axis negative feedback [dexamethasone (DEX) suppression test; DST; n = 5–7 per group], (E and F) self-centered behavior (grooming test; GT), (G) motivation (nest building test; NBT), and (H and I) locomotor activity, were measured at baseline and during the 9-wk UCMS. From day 43, several behavioral domains were evaluated, including (J and K) anhedonia-like (reward-driven exploratory test assessing the motivation to collect a palatable stimulus; latency and number of chews), (L) despair (depressive-like) behavior assessed by increased immobility in the forced swim test (FST; n = 8 per group), (M) anxiety-like behavior evaluated by increased latency to eat the food pellet in the novelty-suppressed feeding test (NSF), (N) aggressiveness identified by shorter attack latency in the resident-intruder (RI) test, and (O) social disturbances reflected by reduced time spent with the unfamiliar conspecific in the UCMS group (social novelty preference test; SNP). Data are shown for n = 9 per group (unless specified otherwise), as LSmean ± 95% CIs, except for (LO) mean ± SEM; *P < 0.05, #P < 0.01, $P < 0.001 (post hoc comparisons for significant “treatment” × “day” interaction in general linear mixed model, or significant t test for nonrepeated measures). For detailed statistics, see Dataset S1. S, session.
Fig. 2.
Fig. 2.
Time course of UCMS-induced alterations on sleep and the EEG. (A) Duration of REMS per 24 h. (B) Duration of REMS episodes per 24 h. (C) EEG theta power density (6–9 Hz) in REMS during the 12-h light phase expressed as the percentage of theta power in baseline. (D) Relative EEG power spectra in REMS during the 12-h light phase (averaged spectra of all EEG recording sessions during the 9-wk UCMS protocol). (E) Duration of NREMS per 24 h. (F) Duration of NREMS episodes per 24 h. (G) EEG delta power density (1–4.5 Hz) during the 12-h light phase expressed as the percentage of delta power in baseline. (H) Relative EEG power spectra in NREMS (averaged spectra of all EEG recording sessions during the 9-wk UCMS protocol). Data are LSmeans ± 95% CI (controls: gray; UCMS: red; n = 8 per group); *P < 0.05, #P < 0.01, $P < 0.001 (post hoc comparisons for significant “treatment” × “day” interaction, except for D and H: effect of “treatment” in general linear mixed model). For detailed statistics, see Dataset S1.
Fig. 3.
Fig. 3.
Effect size of UCMS-induced physical, behavioral, neuroendocrine, and sleep alterations. Effect sizes of repeated (Cohen’s f2) and nonrepeated measures (Cohen’s d were converted to Cohen’s f2 using the following formula: Cohen’s d = 2 × Cohen’s f2), with large effect size: >0.40; medium: 0.25–0.40; small: 0.10–0.25. Bar colors correspond to those displayed in Fig. 1A and SI Appendix, Fig. S5 for all measured phenotypes. For values, see Dataset S1.
Fig. 4.
Fig. 4.
Bivariate associations for physical, behavioral, neuroendocrine, and sleep alterations. (A) Kendall’s partial correlation between pairs of phenotypes (i.e., after removing the effect of the experimental groups). The phenotypes (the averaged last three measurements were used for repeated measures) were ordered according to their phenotypic categories. Correlations were considered significant at an FDR < 0.05 (Padj; symbolized by black-framed square), computed with the Benjamini–Hochberg procedure for multiple testing correction. For detailed statistics, see Dataset S2. (B) Example of a correlation from (A) illustrated for percentage of REMS per TST during the light (L) phase and impairment of the corticosterone regulation (τ = 0.72; Pnom = 0.00034, Padj= 0.0197; n = 8 animals per group; gray: control mice, red: UCMS-subjected animals). DEX supp., dexamethasone suppression.
Fig. 5.
Fig. 5.
Characterization and functional enrichment of genes differentially expressed following chronic mild stress. Overlap of (A) DEGs and (B) significantly enriched GO biological processes for DEGs in the prefrontal cortex, hippocampus, hypothalamus, and whole blood. (C) GO biological processes associated with DEGs. Outer track: tissue; second track: overarching themes associated with GO processes; third track: tissues in which GO processes were found; inner track: overlap of processes, colors corresponding to overarching theme. n = 8 per group for brain regions; n = 7 controls vs. n = 9 UCMS group for blood. Enrichment analyses were performed using MetaCore and significance was set at Padj < 0.05. Information is available in tabular format (Datasets S3 and S4).
Fig. 6.
Fig. 6.
Enriched pathways in transcriptomic predictor sets of sleep variables. (A) Number of enriched pathways associated with REMS and NREMS variables. Colors correspond to functional themes identified by the “Pathway Maps” tool in MetaCore. (B) Number of overlapping pathways between REMS and/or NREMS variables. Colors correspond to the functional themes of pathways. (C) Enriched REMS- (Upper) and NREMS- (Lower) associated pathways. Outer track: phenotypes; second track: functional themes of pathways; third track: tissues in which pathways were found to be significantly enriched; inner track: overlaps between pathways are illustrated with color of functional themes. All depicted pathways were significant at Padj < 0.05; n = 8 per group for brain regions; n = 7 controls vs. n = 9 UCMS group for blood. Lists of enriched pathways are available in tabular format (Dataset S9).

References

    1. Sanford LD, Suchecki D, Meerlo P. Stress, arousal, and sleep. Curr Top Behav Neurosci. 2015;25:379–410. - PubMed
    1. Tafet GE, Nemeroff CB. The links between stress and depression: Psychoneuroendocrinological, genetic, and environmental interactions. J Neuropsychiatry Clin Neurosci. 2016;28:77–88. - PubMed
    1. World Health Organization 2008 The Global Burden of Disease: 2004 Update. Available at https://www.who.int/healthinfo/global_burden_disease/2004_report_update/en/. Accessed September 1, 2018.
    1. Vigo D, Thornicroft G, Atun R. Estimating the true global burden of mental illness. Lancet Psychiatry. 2016;3:171–178. - PubMed
    1. Herman JP, Tasker JG. Paraventricular hypothalamic mechanisms of chronic stress adaptation. Front Endocrinol (Lausanne) 2016;7:137. - PMC - PubMed

Publication types