. 2019 Feb 12;116(7):2551-2560.
doi: 10.1073/pnas.1812963116. Epub 2019 Jan 25.

Discovery of potent SOS1 inhibitors that block RAS activation via disruption of the RAS-SOS1 interaction

Affiliations

Discovery of potent SOS1 inhibitors that block RAS activation via disruption of the RAS-SOS1 interaction

Roman C Hillig et al. Proc Natl Acad Sci U S A. .

Abstract

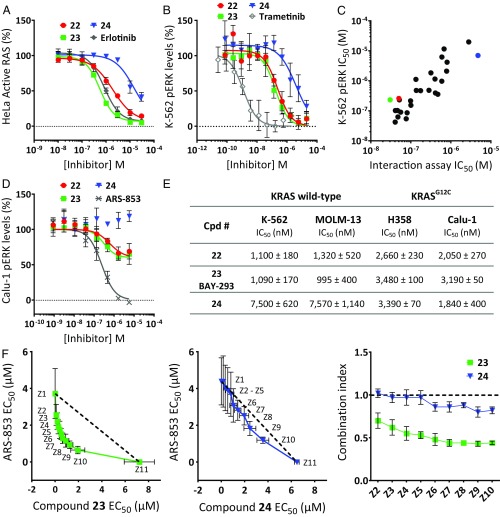
Since the late 1980s, mutations in the RAS genes have been recognized as major oncogenes with a high occurrence rate in human cancers. Such mutations reduce the ability of the small GTPase RAS to hydrolyze GTP, keeping this molecular switch in a constitutively active GTP-bound form that drives, unchecked, oncogenic downstream signaling. One strategy to reduce the levels of active RAS is to target guanine nucleotide exchange factors, which allow RAS to cycle from the inactive GDP-bound state to the active GTP-bound form. Here, we describe the identification of potent and cell-active small-molecule inhibitors which efficiently disrupt the interaction between KRAS and its exchange factor SOS1, a mode of action confirmed by a series of biophysical techniques. The binding sites, mode of action, and selectivity were elucidated using crystal structures of KRASG12C-SOS1, SOS1, and SOS2. By preventing formation of the KRAS-SOS1 complex, these inhibitors block reloading of KRAS with GTP, leading to antiproliferative activity. The final compound 23 (BAY-293) selectively inhibits the KRAS-SOS1 interaction with an IC50 of 21 nM and is a valuable chemical probe for future investigations.

Keywords: RAS; SOS; crystal structure; fragment screen; small-molecule inhibitor.


Conflict of interest statement

Conflict of interest statement: R.C.H. B.S., J.S., D.M., A.H., C.M.S., N.D.W., H.B., U.B., J.W., V.B., J.M., K.P., G.S., N.B., K.E., K.G., L.W., F.v.N., and B.B. are or have been employees and stockholders of Bayer AG. J.D.K. and D.W. are employees of Evotec AG. R.C.H., B.S., J.S., D.M., H.B., K.P., N.B., K.E., L.W., F.v.N., and B.B. are coauthors of a patent application.

Figures

Fig. 1.
Fig. 1.
KRASG12C–SOS1cat NMR fragment screen. (A) Screening cascade (Top) and example spectra for F1 (Bottom): 1D proton spectrum (blue) and STD-NMR spectrum with KRASG12C–SOS1 complex (Cplx.; red), KRASG12C_C118S (green), and SOS1cat (purple). (B) Cocrystal structure of F1 bound to KRASG12C–SOS1cat. (Top) Overall complex with location of the fragment binding site (yellow box); Inset is the area in the yellow box enlarged, showing hydrogen bonds as thin dashed lines and cation–π interaction as a thick dashed line. (C) SPR assay with immobilized SOS1cat. Green line: KRASG12C_C118S; dotted, dashed, and solid blue lines: KRASG12C_C118S in the presence of 100, 250, and 500 µM F1, respectively; dotted, dashed, and solid black lines: respective addition of 100, 250, and 500 µM F1 alone, showing unspecific binding of F1 to SOS1cat; and red line: buffer. (D) F1 and the SOS-activator R1 increase the interaction between KRASG12C_C118S and SOS1cat. (Top) Assay scheme showing RAS, SOS1, and detection antibodies with fluorescent labels (Tb, terbium). (Bottom) Data points represent mean ± SD (n = 4). Normalization: 100% HTRF signal, DMSO control; 0% HTRF signal, without SOS1cat.
Fig. 2.
Fig. 2.
Discovery of quinazolines as direct SOS1 inhibitors that disrupt the KRAS–SOS1 complex. (A, Top) Assay schemes (showing KRAS, fluorescently labeled GDP and GTP nucleotides, SOS1, and detection antibodies with fluorescent terbium label), and (A, Bottom) dose–response curves for GDP, compound 1, and KRAS reference compound R2 (SI Appendix, Table S2), shown for the On-assay (Left) and the secondary Off-assay (Middle). Data points represent mean ± SD (n = 4). (B, Left) TSA. Compound 1 stabilizes SOS1cat with a ΔTm of 2.5 °C. (B, Middle, Top) ITC of the interaction of 1 with SOS1cat. (B, Middle, Bottom) Heat curve of titration of SOS1cat into a solution of 1 and integrated enthalpies plotted against the protein-to-compound molar ratio. Inset shows thermodynamic values obtained from fitting a Wiseman isotherm to the measured calorimetric data. (B, Right) Native MS analysis confirmed binding of 1 to SOS1cat with a 1:1 stoichiometry. (C, Left) HTRF-based KRASG12C–SOS1cat interaction assay showing disruption of the KRASG12C–SOS1cat complex by 1 (red curve); the SOS activator R1 (green curve, SI Appendix, Table S2) leads to a stabilization of the KRASG12C–SOS1cat complex. Data points represent mean ± SD (n = 4). Normalization as in Fig. 1D. (C, Right) SPR assay with immobilized SOS1cat. Green: 250 nM KRASG12C_C118S; blue: 250 nM KRASG12C_C118S in the presence of 10 µM compound 1; black: 10 µM 1 alone, showing unspecific binding of 1 to SOS1cat; and red: buffer. Compound 1 resulted in reduced binding of KRASG12C to immobilized SOS1cat.
Fig. 3.
Fig. 3.
SOS1–compound 1 cocrystal structure, SAR, and crystal structure of SOS2. (A, Left) Cocrystal structure of SOS1SB (carbon atoms in gray) in complex with 1 (stick model, carbon atoms in green). (B, Left) Crystal structure of SOS1SB in complex with 1 (protein carbon atoms in gray, inhibitor carbon atoms in green), superimposed with the crystal structures of apo SOS1SB (selected binding site residues shown, carbon atoms in yellow) and KRASG12C_SB–SOS1cat (KRAS in orange, SOS1 carbon residues in magenta). Magenta dashed line indicates a stacking interaction between the side chain of Tyr884 and KRAS residue Arg73. Red arrow highlights a predicted clash between one of the two methoxy groups of the inhibitor with Arg73KRAS. (C) Superimposition of the crystal structures of SOS1SB (gray ribbon) in complex with 1 and apo SOS2SB (magenta). Overall view (Left) and Inset view (Right) into the inhibitor binding site. (A, Right and B, Right and D) Initial SAR data for the SOS1 inhibitor series. IC50 values measured with the KRASG12C–SOS1cat interaction assay and EGFR kinase inhibition assay (mean values; see SI Appendix, Table S8 for SD and biological replicates).
Fig. 4.
Fig. 4.
Structure-based linking of the fragment and HTS hits. (A, Left) Superimposition of the crystal structures of F1 bound to KRASG12C_SB–SOS1cat (KRAS in orange, SOS1 in gray, F1 and Phe890 with carbon atoms in magenta) and 17 bound to SOS1SB (only inhibitor and Phe890 shown; carbon atoms in green). (Right) Schematic depiction of the merging approach, with 18 as an initial example of the resulting hybrid compounds. (B, Left and C, Left) Crystal structures of SOS1SB in complex with 21 (B) and 23 (C); hydrogen bonds shown as thin dashed lines, cation–π interaction as a thick dashed line. (B, Right and C, Right) IC50 values measured with the KRASG12C–SOS1cat interaction assay (mean values; see SI Appendix, Table S8 for SD and biological replicates). (C, Bottom Right) Dose–response curves for compounds 22 to 24.
Fig. 5.
Fig. 5.
Cellular characterization of compounds 22 to 24. (A) Inhibition of active RAS levels in HeLa cells. (B) pERK levels in K-562 cells. (C) Correlation of IC50 data for pERK inhibition in K-562 cells with biochemical KRAS–SOS1 interaction. (D) pERK levels in Calu-1 cells. The colored dots represent compounds 22 (red), 23 (green), and 24 (blue). Reference compounds (SI Appendix, Table S2) in A, B, and D are indicated in gray. Data points in A, B, and D represent mean ± SD (n = 4). The IC50 values of 22 to 24 for these assays are summarized in SI Appendix, Table S6. (E) Antiproliferative activity against wild-type KRAS cell lines (K-562, MOLM-13) and cell lines with KRASG12C mutation (NCI-H358, Calu-1). Mean IC50 values ± SD, n = 4. (F) Antiproliferative activity of 23 (Left) and 24 (Middle) was assessed in combination with the covalent KRASG12C inhibitor ARS-853 in NCI-H358 cells. IC50 isobologram plots of SOS1-inhibitors (Z1) and ARS-853 (Z11) alone and of fixed combinations (Z2 to Z10) of both compounds are shown. The dotted line represents the line of additivity. Data points represent mean ± SD of biological independent experiments (n = 3). (Right) The combination index was calculated according to the median-effect model of Chou–Talalay (43); a value below 0.8 indicates a more-than-additive (i.e., a synergistic) interaction.

Similar articles

Cited by

References

    1. Der CJ, Krontiris TG, Cooper GM. Transforming genes of human bladder and lung carcinoma cell lines are homologous to the ras genes of Harvey and Kirsten sarcoma viruses. Proc Natl Acad Sci USA. 1982;79:3637–3640. - PMC - PubMed
    1. Parada LF, Tabin CJ, Shih C, Weinberg RA. Human EJ bladder carcinoma oncogene is homologue of Harvey sarcoma virus ras gene. Nature. 1982;297:474–478. - PubMed
    1. Santos E, Tronick SR, Aaronson SA, Pulciani S, Barbacid M. T24 human bladder carcinoma oncogene is an activated form of the normal human homologue of BALB- and Harvey-MSV transforming genes. Nature. 1982;298:343–347. - PubMed
    1. Cox AD, Fesik SW, Kimmelman AC, Luo J, Der CJ. Drugging the undruggable RAS: Mission possible? Nat Rev Drug Discov. 2014;13:828–851. - PMC - PubMed
    1. Hobbs GA, Der CJ, Rossman KL. RAS isoforms and mutations in cancer at a glance. J Cell Sci. 2016;129:1287–1292. - PMC - PubMed

MeSH terms

Substances

LinkOut - more resources