. 2019 Jan 25;10(1):442.
doi: 10.1038/s41467-019-08390-z.

The functional synergism of microRNA clustering provides therapeutically relevant epigenetic interference in glioblastoma

Affiliations

The functional synergism of microRNA clustering provides therapeutically relevant epigenetic interference in glioblastoma

Vivek Bhaskaran et al. Nat Commun. .

Abstract

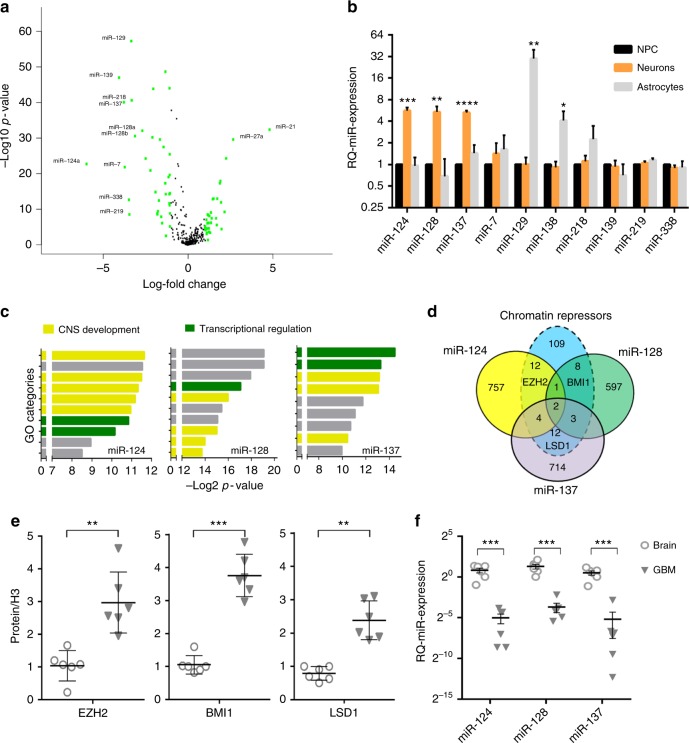
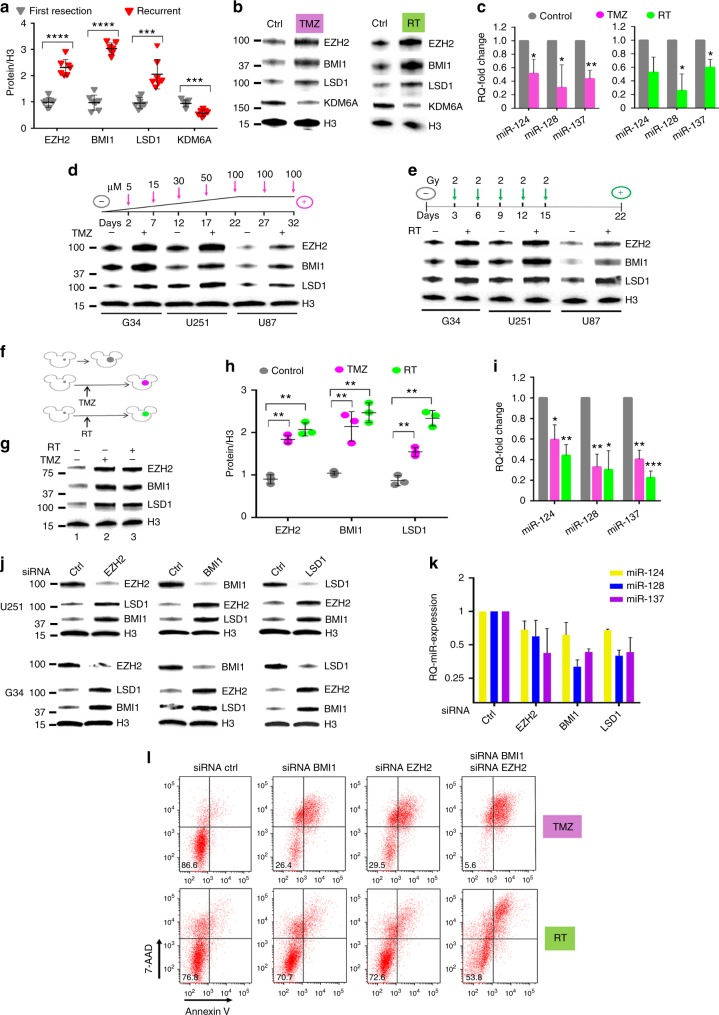
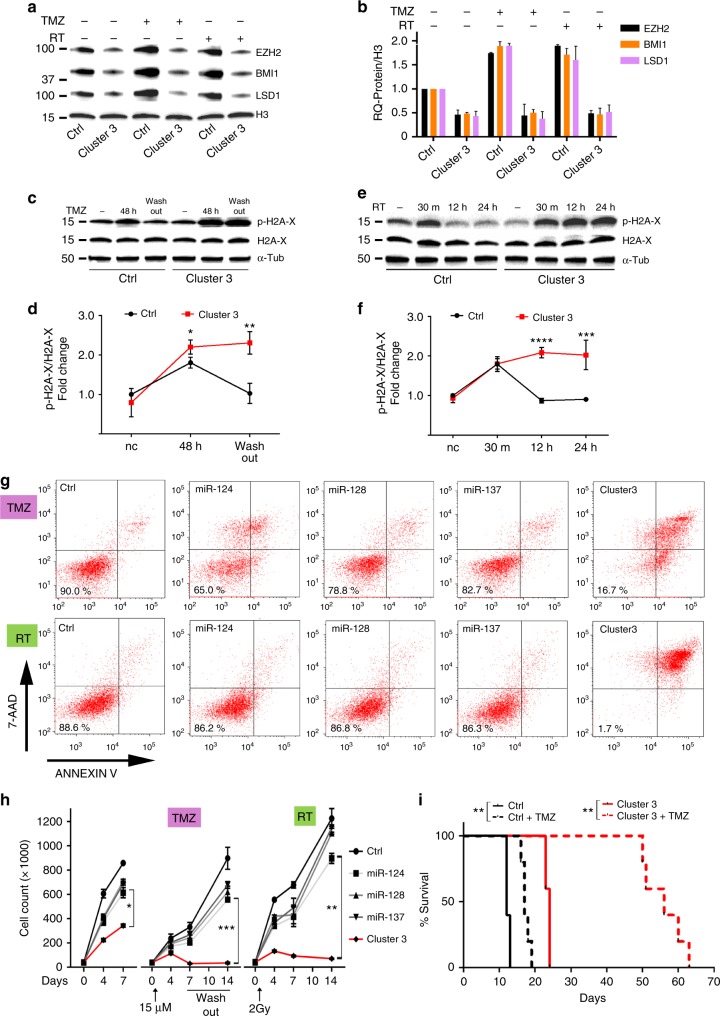
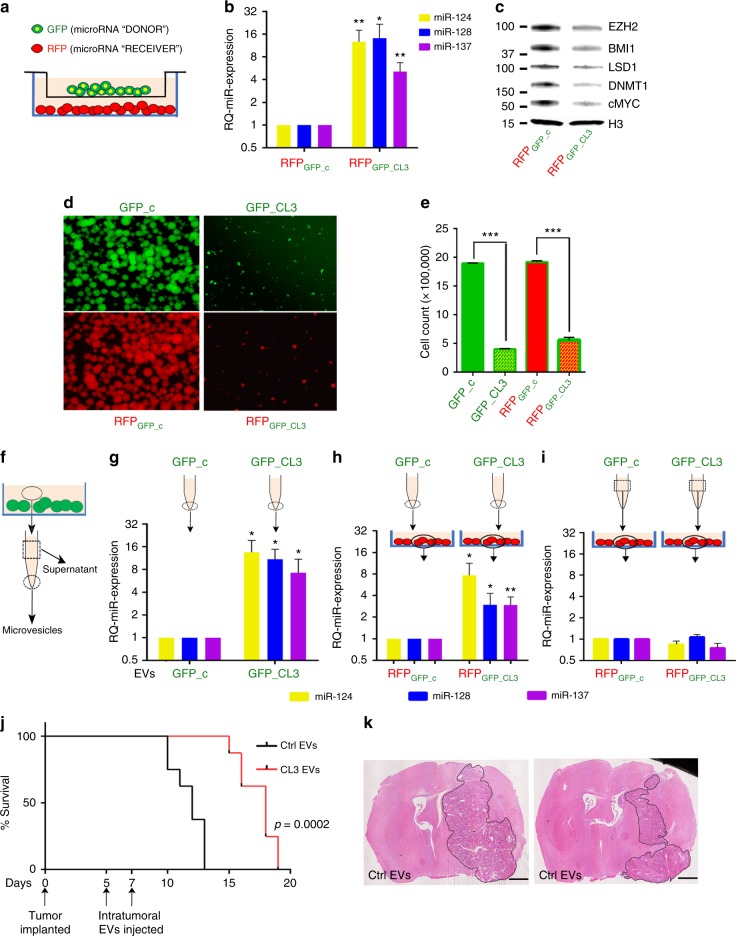
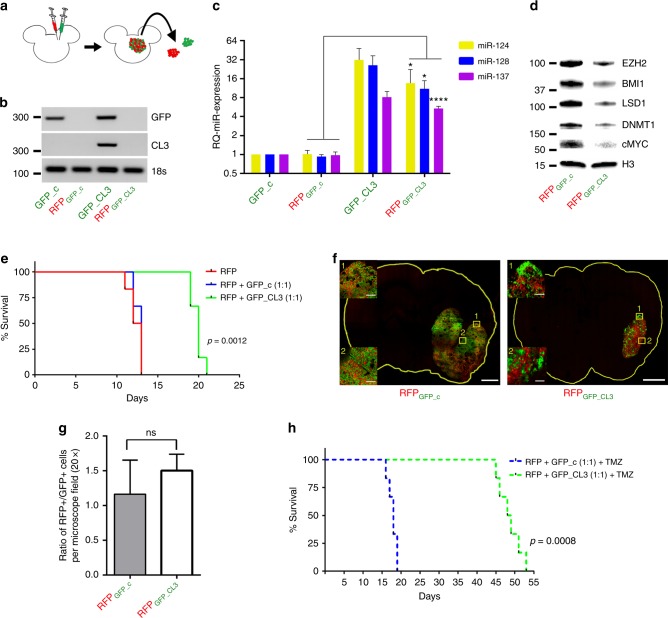
MicroRNA deregulation is a consistent feature of glioblastoma, yet the biological effect of each single gene is generally modest, and therapeutically negligible. Here we describe a module of microRNAs, constituted by miR-124, miR-128 and miR-137, which are co-expressed during neuronal differentiation and simultaneously lost in gliomagenesis. Each one of these miRs targets several transcriptional regulators, including the oncogenic chromatin repressors EZH2, BMI1 and LSD1, which are functionally interdependent and involved in glioblastoma recurrence after therapeutic chemoradiation. Synchronizing the expression of these three microRNAs in a gene therapy approach displays significant anticancer synergism, abrogates this epigenetic-mediated, multi-protein tumor survival mechanism and results in a 5-fold increase in survival when combined with chemotherapy in murine glioblastoma models. These transgenic microRNA clusters display intercellular propagation in vivo, via extracellular vesicles, extending their biological effect throughout the whole tumor. Our results support the rationale and feasibility of combinatorial microRNA strategies for anticancer therapies.


Conflict of interest statement

E.A.C. is currently an advisor to Advantagene Inc., Alcyone Biosciences, Insightec, Inc., Sigilon Therepeutics and DNAtrix Inc. and has equity interest in DNAtrix; he has also advised Oncorus, Merck, Tocagen, Ziopharm, Stemgen, NanoTx., Ziopharm Oncology, Cerebral Therapeutics, Genenta, Janssen, Karcinolysis, and Shanghai Biotech. The other authors declare no competing interests.

Figures

Fig. 1
Fig. 1
A neuronal microRNA module targets multiple chromatin modifying proteins in GBM. a Volcano plot showing the most deregulated microRNAs in glioblastomas (n = 520) vs. normal brain (n = 10). Green color = >4-fold change in expression. b Real-time quantitative PCR analysis of microRNA expression in human neural progenitor cells (NPC) upon induction of lineage-specific differentiation. Mean ± SD from three biological replicates. c Schematic representation of the ten most enriched GO categories among the predicted targets of miR-124, miR-128, and miR-137, respectively. Yellow color denotes genes with involvement in neural development. Green color denotes genes with involvement in transcriptional regulation. Gray color denotes any other biological process. d Venn diagram crossing the predicted targetome of each microRNA against the group of genes with repressive chromatin function according to GO analysis. e Semiquantitative protein quantification of western blot analysis from operatory specimen lysates. For each protein, all samples were equalized to the expression level of Normal Brain #1. f Relative quantification of microRNA expression in clinical samples of GBM and brain by real-time PCR. All samples were equalized to the expression level of Normal Brain #1.*p < 0.05; **p < 0.01; ***p < 0.001; ****p < 0.0001 (Student’s t test, two tails). GBM gliobastoma
Fig. 2
Fig. 2
Epigenetic-mediated, multiprotein-enacted GBM escape from genotoxic therapy. a Protein quantification from operatory specimen of glioblastomas at time of first diagnosis vs. after recurrence. For each protein, all samples were equalized to the expression level of First Resection sample #1. b Protein expression of G34 cells treated with either 15 μM TMZ or 2 Gy of ionizing irradiation, and harvested 24 h after treatment. One representative experiment is shown. c Relative quantification of microRNA expression in G34 cells treated as in b. Mean ± SD from three independent experiments. d Protein expression analysis of three different GBM cell lines treated with progressively increasing concentration of TMZ over 5 weeks, or e repeated radiation treatment, as schematized by each corresponding cartoon. f Cartoon exemplifying in vivo experiment: tumors grown after the treatment are color-coded: violet denotes tumor after TMZ, green denotes tumor after radiation. Untreated tumors are colored in gray. g Representative western blot comparing protein expression from intracranial tumors recovered at the time of mouse euthanasia, either without treatment (mouse 1), after TMZ (mouse 2) and after radiation therapy (mouse 3). h Protein quantification from mice in f and g. i Relative quantification of microRNA expression from tumors in f and g. All samples were equalized to the expression level of control mouse #1. j Western blot showing protein level after siRNA-mediated inhibition of specific epigenetic proteins in two different GBM cell lines. k Relative quantification of microRNA expression after siRNA knockdown in G34 cells. l FACS analysis of cell death and apoptosis after single or double siRNA knockdown of BMI1 and/or EZH2 in U251 cells 24 h after treatment with either 15 μM TMZ (upper row) or 2 Gy of ionizing radiation (lower row). Percent of living cells is reported in each left lower quadrant. 7-AAD 7-amino-actynomicin-D. For all panels, reported are mean ± SD. *p < 0.05; **p < 0.01; ***p < 0.001; ****p < 0.0001 (Student’s t test, two tails). GBM glioblastoma, TMZ temozolomide
Fig. 3
Fig. 3
Biological effects of microRNA clustering. a Cartoon depicting the engineering of Cluster 3. b Relative quantification of microRNA expression in G34 GSC transduced with Cluster 3 transgene or negative control (GFP-only transgene). c Representative Western blot from whole cell protein lysate of G34 GSC stably expressing different microRNAs. d Relative quantification of MAP2 and TUBB3 (β3-tubulin) gene expression by quantitative real-time PCR after microRNA overexpression. e Western blot from G34 GSC showing p21 protein level after microRNA overexpression. f Soft agar clonogenic assay. Representative images of GFP-positive G34 cells 14 days after plating into 12-well plates (1000 cells/well). Image acquired with ×4 optical lens (4 × 4 tile scanning). g Total count of colonies in e. h Kaplan−Meier survival curve of female athymic nu/nu mice intracranially implanted with 10,000 G34 GSC stably expressing the indicated microRNAs (or negative control GFP). Six mice/group. Log Rank test, corrected by Bonferroni analysis. **p < 0.001. i Representative hematoxylin and eosin stain of paraformaldehyde-fixed brains from mice in c. All brains were collected at day 12 post-tumor implantation. Scale bars: 1 mm. For all bar graphs, means ± SD from three independent experiments are reported. *p < 0.05; **p < 0.01; ***p < 0.001; ****p < 0.0001 (Student’s t test, two tails, multiple comparisons). GSC glioblastoma stem-like cell
Fig. 4
Fig. 4
Clustered microRNAs impede GBM escape from genotoxic stress. a Western blot from whole-cell lysate of G34 expressing either negative control or Cluster 3 transgene 24 h after either 15 μM TMZ or 2 Gy ionizing radiation. b Quantification of proteins from a. Values reported represent mean + SD from two separate experiments. c, d Representative western blots for phospho-H2A-x and H2A-x in G34 GSC after 48 h incubation with 15 μM TMZ and further 48 h after TMZ washout, and relative protein quantification (mean + SD, n = 3) e, f Representative western blot for phospho-H2A-x and H2A-x in G34 GSC 30 min, 12 h and 24 h after 2 Gy irradiation, and relative protein quantification based on three independent experiments (reported values are mean ± SD). g FACS-based analysis of cell death and apoptosis in G34 GSC expressing either single miRs or Cluster 3 transgene, in the presence of either 15 μM TMZ (upper row) for 5 days or 5 days after treatment with 2 Gy of ionizing radiation (lower row). Percent of living cells is reported in each left lower quadrant. 7-AAD 7-amino-actynomicin-D. h Cell count per well of G34 GSCs expressing different microRNAs at different time points and in different genotoxic conditions (Left panel: no additional treatment; Central panel: TMZ; Right panel: radiation). Reported is the mean ± SD from three independent experiments. For all graphs, *p < 0.05; **p < 0.01; ***p < 0.001; ****p < 0.0001 (Student’s t test, two tails). i Survival curve of nude mice intracranially implanted with 10,000 G34 GSC differentially expressing clustered microRNAs, and with/without 5 days treatment with 20 mg/kg IP TMZ starting at day 7 post implantation (six mice/group). **p < 0.01, Log Rank corrected by Bonferroni analysis. GSC glioblastoma stem-like cell
Fig. 5
Fig. 5
Vesicle-mediated transfer of clustered transgenic microRNAs. a Cartoon depicting transwell assay used for microRNA transfer analysis. b Relative quantification of microRNA expression by RT PCR in cocultured cells. Reported are means ± SD from three independent experiments. c Representative western blot analysis of proteins in RFP+ cells. d Representative fluorescent microscope images of G34 neurospheres in different co-culturing conditions, with relative cell count/12-well reported in e as mean values ± SD from three experiments. f Cartoon depicting the processing of conditioned medium from GFP-positive cells into microvesicular component (dotted circle) and supernatant (dotted square), as used in the following panels. g Real-time PCR quantification of microRNA expression in EVs recovered from conditioned medium. h microRNA expression from RFP-positive cells cultured for 36 h with 10 µg/ml of purified EVs, or, i 2 ml of conditioned medium deprived of EVs (supernatant) obtained from GFP-positive cells. j Survival of mice after intratumor injection of EVs (10 μg total by protein quantification delivered in two injections) purified either from negative control cells (ctrl EVs) or Cluster 3 cells (CL3 EVs). n = 6 mice per group. k Hematoxylin & Eosin stains of representative brains at time of control mouse endpoint. Scale bars: 1 mm. Represented are means ± SD from three independent experiments. *p < 0.05; **p < 0.01; ***p < 0.0001 (Student’s t test, two tails). EV extracellular vesicle
Fig. 6
Fig. 6
In vivo evidence of microRNA transfer to bystander cells. a Scheme of experimental protocol. Red = RFP; Green = GFP. b Semiquantitative PCR of Cluster 3 and GFP transgene expression across the four different sorted cell populations. c Relative quantification of microRNA expression in G34 cells recovered from mixed intracranial brain tumors at time of mouse euthanasia (day 12). n = 3 animals/group. d Representative western blot analysis of protein amount in RFP control cells vs. RFP-Cl3. e Survival curve of athymic nu/nu mice (6 per group) intracranially implanted with RFP/GFP control vs. RFP/GFP-Cluster3 mixed in a 1:1 ratio. f Confocal microscopy image of one representative brain per group sacrificed at day 12, showing the two cell populations, at low magnification and ×20 magnification. Scale bars: 1 mm (whole slide); 100 µm (inserts). g Ratio of RFP+/GFP+ cells per ×20 microscopy field (mean ± SD from nine random fields/tumor). h Survival curve of athymic mice (six per group) as described in e, with the addition of 20 mg/kg IP TMZ for 5 days starting at day 7 post implantation (Student’s t test, two tails). *p < 0.05; ****p < 0.0001

Comment in

References

    1. Calin GA, et al. Frequent deletions and down-regulation of micro- RNA genes miR15 and miR16 at 13q14 in chronic lymphocytic leukemia. Proc. Natl. Acad. Sci. USA. 2002;99:15524–15529. - PMC - PubMed
    1. Chan JA, Krichevsky AM. Kosik KS.MicroRNA-21 is an antiapoptotic factor in human glioblastoma cells. Cancer Res. 2005;65:6029–6033. - PubMed
    1. Ciafrè SA, et al. Extensive modulation of a set of microRNAs in primary glioblastoma. Biochem. Biophys. Res. Commun. 2005;334:1351–1358. - PubMed
    1. Nikaki A, Piperi C, Papavassiliou AG. Role of microRNAs in gliomagenesis: targeting miRNAs in glioblastoma multiforme therapy. Expert Opin. Investig. Drugs. 2012;21:1475–1488. - PubMed
    1. Ahir BK, Ozer H, Engelhard HH, Lakka SS. MicroRNAs in glioblastoma pathogenesis and therapy: a comprehensive review. Crit. Rev. Oncol. Hematol. 2017;120:22–33. - PubMed

Publication types

MeSH terms