. 2019 Jan 25;10(1):448.
doi: 10.1038/s41467-018-08271-x.

FGL2 promotes tumor progression in the CNS by suppressing CD103+ dendritic cell differentiation

Affiliations

FGL2 promotes tumor progression in the CNS by suppressing CD103+ dendritic cell differentiation

Jun Yan et al. Nat Commun. .

Erratum in

Abstract

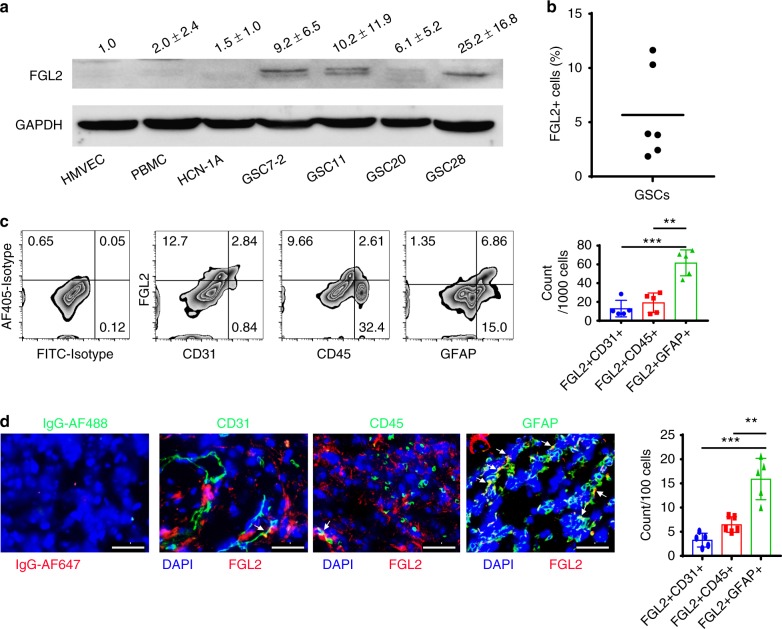
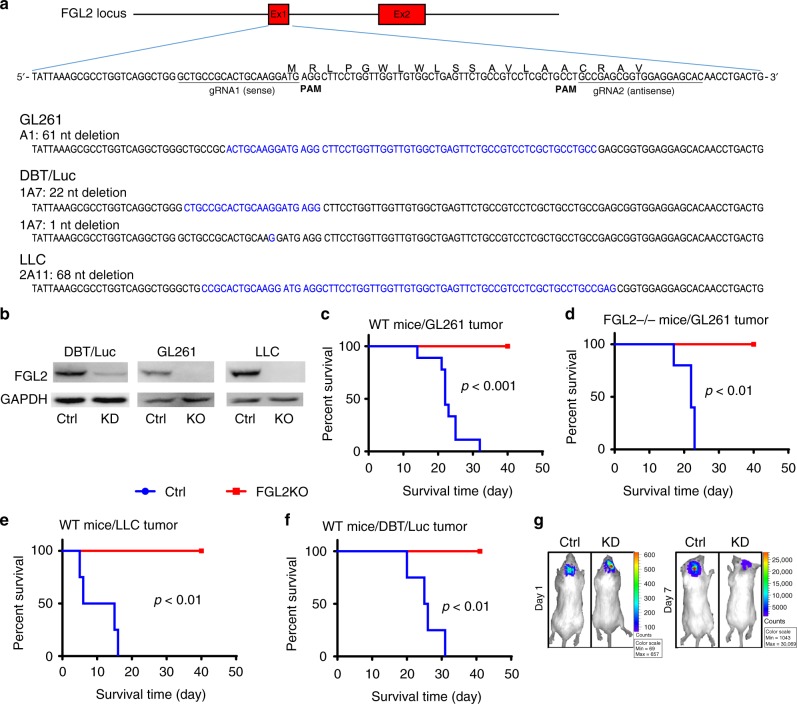
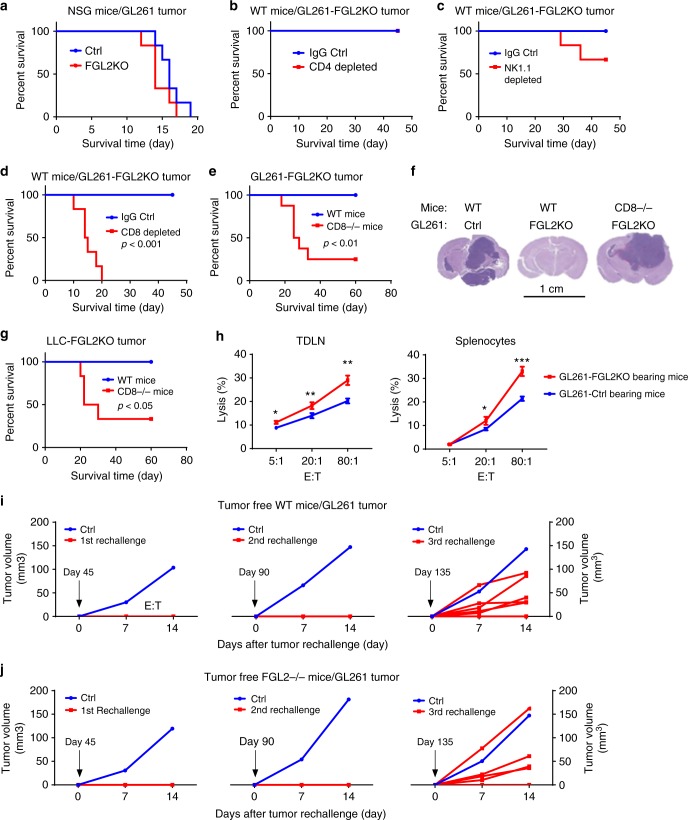
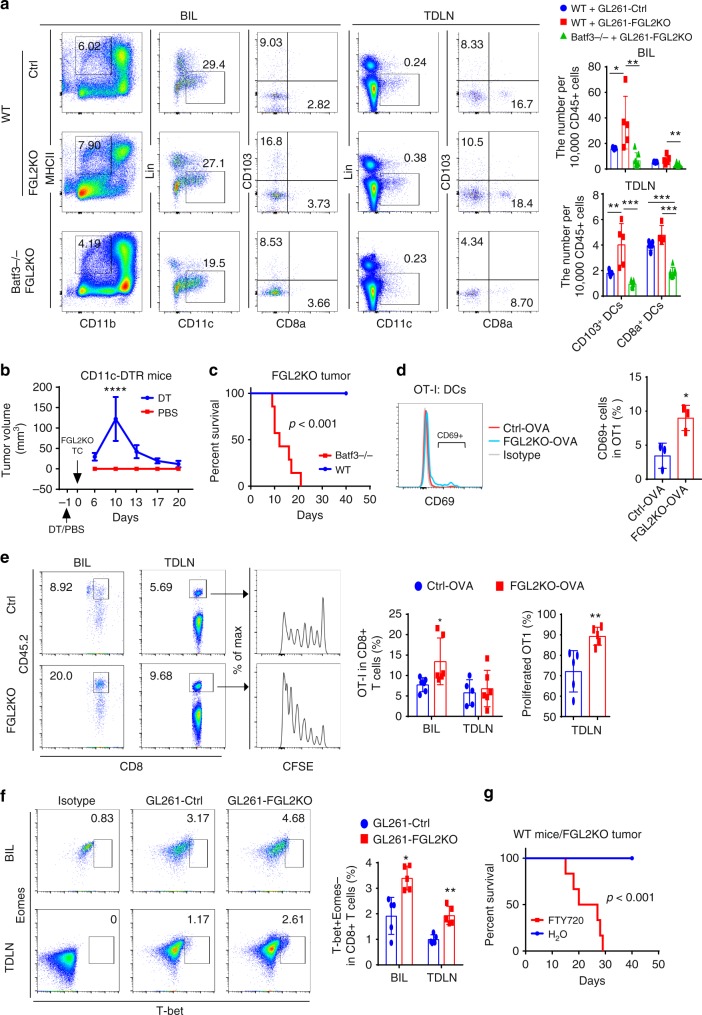
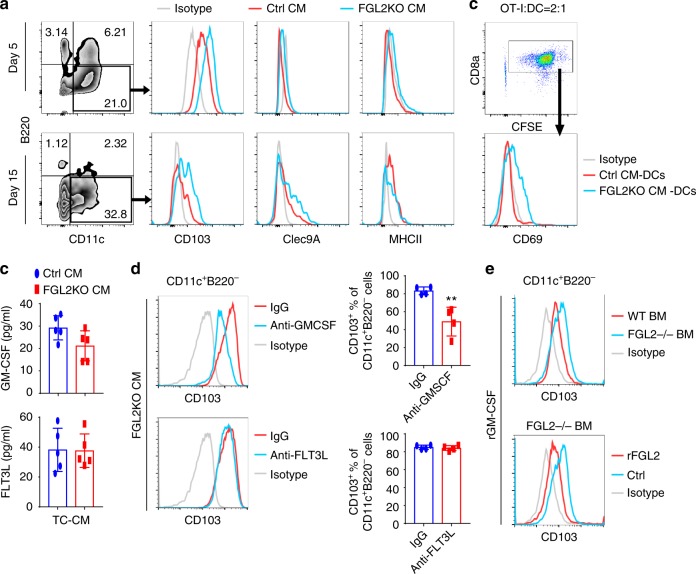
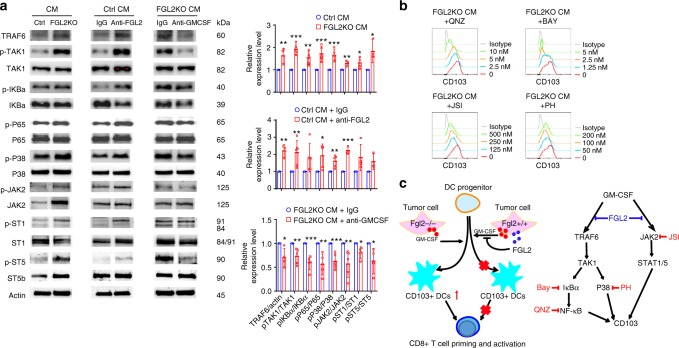
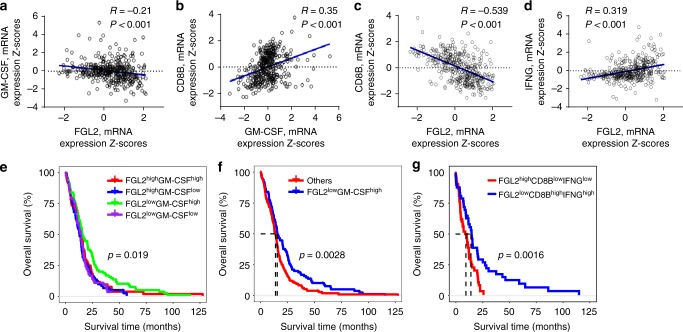
Few studies implicate immunoregulatory gene expression in tumor cells in arbitrating brain tumor progression. Here we show that fibrinogen-like protein 2 (FGL2) is highly expressed in glioma stem cells and primary glioblastoma (GBM) cells. FGL2 knockout in tumor cells did not affect tumor-cell proliferation in vitro or tumor progression in immunodeficient mice but completely impaired GBM progression in immune-competent mice. This impairment was reversed in mice with a defect in dendritic cells (DCs) or CD103+ DC differentiation in the brain and in tumor-draining lymph nodes. The presence of FGL2 in tumor cells inhibited granulocyte-macrophage colony-stimulating factor (GM-CSF)-induced CD103+ DC differentiation by suppressing NF-κB, STAT1/5, and p38 activation. These findings are relevant to GBM patients because a low level of FGL2 expression with concurrent high GM-CSF expression is associated with higher CD8B expression and longer survival. These data provide a rationale for therapeutic inhibition of FGL2 in brain tumors.


Conflict of interest statement

The authors declare no competing interests.

Figures

Fig. 1
Fig. 1
FGL2 is expressed by glioma cells. a FGL2 protein levels were detected by western blot in human peripheral blood monocytes (PBMCs) from healthy donors, normal endothelial cells (HMVECs), normal neurons (HCN-1A), and four glioma stem cell lines (GSC7-2, GSC11, GSC20, and GSC28). Western blots shown are representative, and quantities are summarized as ratio changes from three independent experiments. Glyceraldehyde 3-phosphate dehydrogenase (GAPDH) was used as a protein-loading control. b Percentage of FGL2+ cells in cultured human GSCs. c Representative flow cytometry plots of FGL2 expression on CD45+, CD31+, or GFAP+ cells from tumors of patients with newly diagnosed GBM. Data (n = 5) are presented as the mean ± S.D. and analyzed by one-way ANOVA. d Sections of clinical GBM samples were double stained for co-expression of FGL2 (red) and GFAP (green), or of FGL2 (red) and CD45 (green), or of FGL2 (red) and CD31 (green). Nuclei were counterstained with DAPI (blue). White arrows point to co-localization. Scale bars, 50 μm. Data are presented as the mean ± S.D., and representative images are shown (n = 5). A one-way ANOVA was used to calculate the two-sided P values. Significant results were presented as **P < 0.01, ***P < 0.001
Fig. 2
Fig. 2
FGL2 knockout in tumor cells abolishes tumor progression. a Results of DNA fragment deletion in FGL2 exon 1 in individual clones were validated by gene sequencing. Paired gRNAs were designed to excise exon 1 at the mouse FGL2 locus. Individual clones isolated from cells transfected with gRNAs were assayed for deletions and inversions by RT-PCR. b Expression level of FGL2 in three tumor-cell lines, control (Ctrl) and FGL2-knockout (KO) or knockdown (KD) tumor cells, was detected by western blotting. The western blots shown represent three independent experiments. c Survival curve of wild-type (WT) immunocompetent C57BL/6 mice implanted with GL261-Ctrl or GL261-FGL2KO tumor cells (5 × 104 cells per mouse; n = 9 per group). d Survival curve of FGL2−/− mice implanted with GL261-Ctrl or GL261-FGL2KO tumor cells (5 × 104 cells per mouse; n = 5/group). e Survival curve of WT immunocompetent C57BL/6 mice implanted with Lewis lung cancer (LLC)-Ctrl or LLC-FGL2KO tumor cells (5 × 104 cells per mouse; n = 4 per group). f Survival curve of WT immunocompetent BALB/C mice implanted with mouse astrocytoma (DBT)-Ctrl cells or DBT-FGL2KD tumor cells (5 × 104 cells per mouse; n = 4 per group). g Bioluminescence imaging showing DBT-Ctrl and DBT-FGL2KD tumors at day 1 and day 7 after tumor-cell implantation. All data are representative of at least two independent experiments. The survival curves were analyzed by Kaplan–Meier analysis and the log-rank test was used to compare overall survival between groups
Fig. 3
Fig. 3
CD8+ T cell-dependent clearance of FGL2KO tumor. a Survival analysis of immunodeficient NSG mice implanted with GL261-Ctrl or GL261-FGL2KO tumor cells (5 × 104 cells per mouse; n = 6 per group). bd Survival analysis of WT immunocompetent C57BL/6 mice implanted with GL261-FGL2KO tumor cells and treated with anti-CD4 (GK1.5), anti-NK1.1 (PK136), or anti-CD8 (2.43) depletion antibody or IgG as control (Ctrl) (n = 6 per group). e Survival analysis of WT mice and CD8−/− mice implanted with GL261-FGL2KO tumor cells (n = 6–8 per group). f H&E-stained histopathological sections of brain tissues from representative mice from each group shown in e. Scale bar = 1 cm. g Survival analysis of WT mice and CD8−/− mice implanted with LLC-FGL2KO tumor cells (n = 6 per group). h Cytolytic activity of CD8+ T cells from tumor-bearing mice against GL261 tumor cells. Lymphocytes from tumor-draining lymph nodes (TDLNs) or spleens of mice implanted with FGL2KO tumor cells caused significantly more tumor lysis than those from mice implanted with Ctrl tumor cells (n = 3 mice per group). Two-way ANOVA was used to calculate the two-sided P values. E:T, the ratio of effector cells to target cells. *P < 0.05, **P < 0.01, ***P < 0.001 compared with GL261-Ctrl tumor-bearing mice. i Tumor rechallenge by subcutaneous implantation of GL261-Ctrl cells at days 45, 90, and 135 days after primary challenge of GL261-FGL2KO by intracerebral implantation in WT mice (n = 7). Subcutaneous growth of GL261-Ctrl tumors in age-matched naive WT mice challenged with GL261-Ctrl cells at the same times but without primary challenge is also shown. j The experiment shown in i was repeated in FGL2−/− mice (n = 6). All data are representative of at least two independent experiments. The survival curves were analyzed by Kaplan–Meier analysis and the log-rank test was used to compare overall survival between groups
Fig. 4
Fig. 4
Batf3-dependent CD103+ dendritic cells are required for CD8+ T cells priming. a Brain-infiltrating leukocytes (BIL) and tumor-draining lymph nodes (TDLNs) of Ctrl or FGL2KO tumor-bearing wild-type (WT) mice and FGL2KO tumor-bearing Batf3−/− mice were analyzed for CD103+/CD8a+ dendritic cell (DCs) populations on day 7 post tumor implantation. Data are presented as the mean ± S.D. and were analyzed by one-way ANOVA (n = 5–7 per group). b FGL2KO tumor progression in CD11c-DTR mice treated with diphtheria toxin (DT) or PBS. FGL2KO tumor cells were implanted subcutaneously into CD11c-DTR mice on day 1 after injection of DT or PBS. Data are presented as the mean ± S.D. (n = 8 per group). c Survival analysis of Batf3−/− mice implanted with GL261-FGL2KO tumor cells (n = 7 per group). d FACS assay of CD69 on naive OT-I CD8+ T cells co-cultured with DCs isolated from tumors at a ratio of 1:2. Data are presented as the mean ± S.D. (n = 3 mice per group) and were analyzed by t-test. e Abundance and proliferation of CFSE-labeled OT-I cells in brains and TDLNs of GL261-Ctrl-OVA or GL261-FGL2KO-OVA tumor-bearing mice. CFSE-labeled OT-I cells were adoptively transferred to tumor-bearing CD45.1 mice on day 2 after tumor implantation. Brains and TDLNs were collected 5 days later for analyzing the presence and proliferation of the CD45.2+CD8+ T cell population. Data are presented as the mean ± S.D. (n = 5-6 per group) and were analyzed by t-test. f Representative cytometric analysis of CD8+ T cell priming (CD8+T-bet+Eomes) in BIL and TDLNs at 7 days after tumor implantation. Data are presented as the mean ± S.D. (n = 5 per group) and were analyzed by t-test. g Survival analysis of WT mice implanted with GL261-FGL2KO tumor cells treated with FTY720. Mice were treated with 1 mg/kg FTY720 1 h before tumor-cell implantation and were maintained with drinking water containing 2 μg/mL FTY720 for the duration of the experiment (n = 6 per group). All data are representative of at least two independent experiments. The survival curves were analyzed by Kaplan–Meier analysis and the log-rank test was used to compare overall survival between groups. Significant results were presented as *P < 0.05, **P < 0.01, ***P < 0.001
Fig. 5
Fig. 5
FGL2 suppresses GM-CSF-dependent CD103 induction on cDCs in vitro. a Expression of CD103 on CD11c+B220 DCs cultured with conditioned medium (CM) for 5 or 15 days. Bone marrow cells were isolated from C57BL/6 mice and then cultured with Ctrl-CM (CM from Ctrl tumor cells) or FGL2KO-CM (CM from FGL2KO tumor cells) for 5 days or 15 days. Non-adherent cells were recovered, stained, and analyzed by FACS to determine the expression levels of CD103, Clec9A, and MHCII on the CD11c+B220 DCs. b OT-I T cell activation by OVA-pulsed CM-cultured bone marrow DCs. Non-adherent bone marrow DCs were recovered from CM-cultured bone marrow DCs at 15 days. The bone marrow DCs (2 × 104) were incubated with soluble OVA protein (100 μg/mL) for 2 h and then washed twice before co-culturing with the CFSE-labeled OT-I cells (5 × 104). OT-I activation was measured by CD69 expression level, which was determined by flow cytometry. c Protein levels of GM-CSF and FLT3L in medium conditioned by tumor cells were detected by ELISA. Data were summarized from five independent experiments and were analyzed by paired t-test. d Representative FACS assay of CD103 expression on CD11c+B220 DCs cultured with FGL2KO-CM in the presence of neutralization antibody anti-GM-CSF (5 μg/mL) or anti-FLT3L (5 μg/mL) for 5 days. Data were summarized from four independent experiments and were analyzed by paired t-test. **P < 0.01 comparing with IgG. e Representative FACS assay of CD103 expression on wild-type (WT) and FGL2KO bone marrow (BM) cells cultured with rmGM-CSF (10 ng/mL) for 7 days with or without rFGL2 (200 ng/mL). All plots are representative of three independent experiments
Fig. 6
Fig. 6
FGL2 suppresses NF-κBp65 and STAT1/5 signaling for CD103 induction. a, Expression levels of key proteins in the TAK1-NF-κB/p38 cascades and JAK2/STAT1/5 signaling were examined by western blotting in bone marrow cells cultured with conditioned medium (CM) from control tumor cells (Ctrl), FGL2KO tumor cells, Ctrl-CM + IgG, Ctrl-CM + anti-FGL2, FGL2KO-CM + IgG, or FGL2KO-CM + anti-GM-CSF for 3 days. Data were summarized as ratio changes from at least three independent experiments. The t-test was used to calculate the two-sided P values. Significant results were presented as *P < 0.05, **P < 0.01, ***P < 0.001. b Representative FACS analysis of CD103 expression on CD11c+B220- dendritic cells (DCs), which were pretreated for 1 h with IκBα inhibitor Bay 11-7085 (Bay), NF-κB inhibitor 6-amino-4-(4-phenoxyphenylethylamino) quinazoline (QNZ), JAK2 inhibitor JSI-124 (JSI), or p38 inhibitor PH797804 (PH) in bone marrow cells cultured with CM for 5 days. Plots are representative of three independent experiments. c Schematic illustration of cellular and molecular events underlying FGL2-regulated GBM progression. Tumor cells secreted GM-CSF and FGL2 simultaneously. GM-CSF-induced CD103+ DCs development was blocked in the presence of FGL2, so that CD8+ T cells were not primed and activated because of small CD103+ DC populations. Less CD103+ DC differentiation and subsequent lack of CD8+ T cell priming and activation resulted in GBM progression. For molecular signaling, TRAF6/TAK1/NF-κB/p38 signal and JAK2/STAT1/5 were activated in response to GM-CSF, contributing to CD103 induction. These signaling cascades were blocked by FGL2, thereby suppressing CD103 induction on DCs
Fig. 7
Fig. 7
Expression level of FGL2 and GM-CSF predicts outcome in GBM patients. Data on survival of GBM patients and gene mRNA expression data (n = 401 patients) were downloaded and retrieved from the TCGA data portal ([http://www.cbioportal.org/public-portal/] Accessed between January 1, 2018, and March 15, 2018). The expression levels for both genes were categorized as high or low using median values as the cutoffs. ad Correlations analysis of mRNA expression levels among FGL2, GM-CSF, CD8B, and IFNG in GBM tumors analyzed using the Pearson correlation coefficient. R = Pearson correlation coefficient. e Kaplan–Meier survival analysis for OS of GBM patients in the TCGA dataset grouped by expression levels of FGL2 and GM-CSF mRNA. Patients’ tumors were classified as FGL2highGM-CSFlow, FGL2highGM-CSFhigh, FGL2lowGM-CSFlow, or FGL2lowGM-CSFhigh. The log-rank test was used to compare overall survival among groups. f Kaplan–Meier survival analysis for OS of GBM patients in the FGL2lowGM-CSFhigh group vs. all others. The log-rank test was used to compare overall survival between groups. g Kaplan–Meier survival analysis for OS of GBM patients in the FGL2lowCD8BhighIFNGhigh group vs. those in the FGL2highCD8BlowIFNGlow group. The log-rank test was used to compare overall survival between groups. The statistical analyses were conducted using the R software package

Similar articles

Cited by

References

    1. Prasetyanti PR, Medema JP. Intra-tumor heterogeneity from a cancer stem cell perspective. Mol. Cancer. 2017;16:41. doi: 10.1186/s12943-017-0600-4. - DOI - PMC - PubMed
    1. Singh SK, et al. Identification of human brain tumour initiating cells. Nature. 2004;432:396–401. doi: 10.1038/nature03128. - DOI - PubMed
    1. Wainwright DA, et al. IDO expression in brain tumors increases the recruitment of regulatory T cells and negatively impacts survival. Clin. Cancer Res. 2012;18:6110–6121. doi: 10.1158/1078-0432.CCR-12-2130. - DOI - PMC - PubMed
    1. Gardner A, Ruffell B. Dendritic cells and cancer immunity. Trends Immunol. 2016;37:855–865. doi: 10.1016/j.it.2016.09.006. - DOI - PMC - PubMed
    1. Roberts EW, et al. Critical role for CD103 + /CD141 + dendritic cells bearing CCR7 for tumor antigen trafficking and priming of T cell immunity in melanoma. Cancer Cell. 2016;30:324–336. doi: 10.1016/j.ccell.2016.06.003. - DOI - PMC - PubMed

Publication types

MeSH terms