. 2019 Jan 25:11:450-465.
doi: 10.1016/j.isci.2018.12.035. Epub 2019 Jan 4.

Potential for Heightened Sulfur-Metabolic Capacity in Coastal Subtropical Microalgae

Affiliations

Potential for Heightened Sulfur-Metabolic Capacity in Coastal Subtropical Microalgae

David R Nelson et al. iScience. .

Abstract

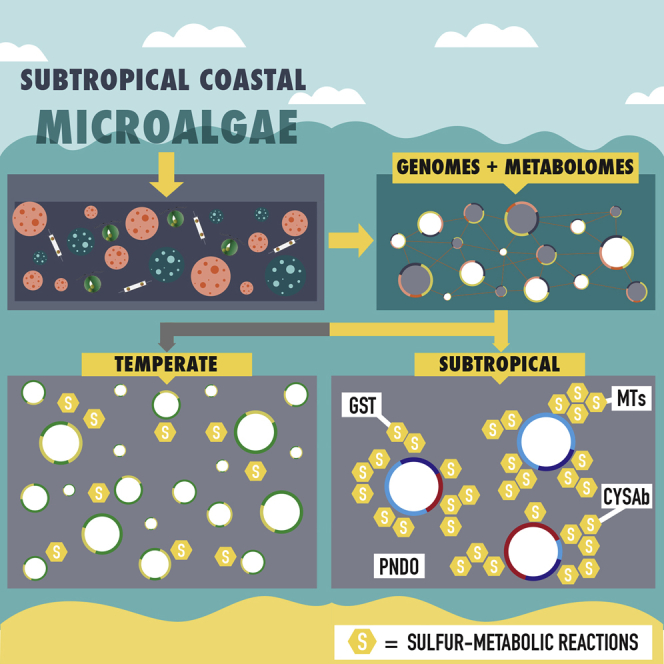
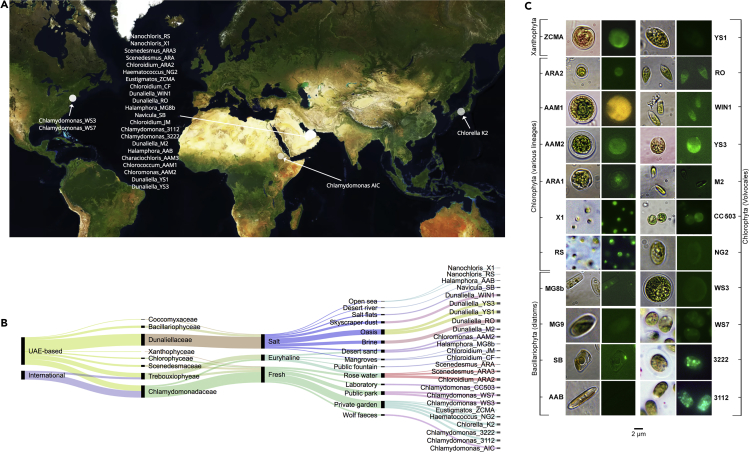
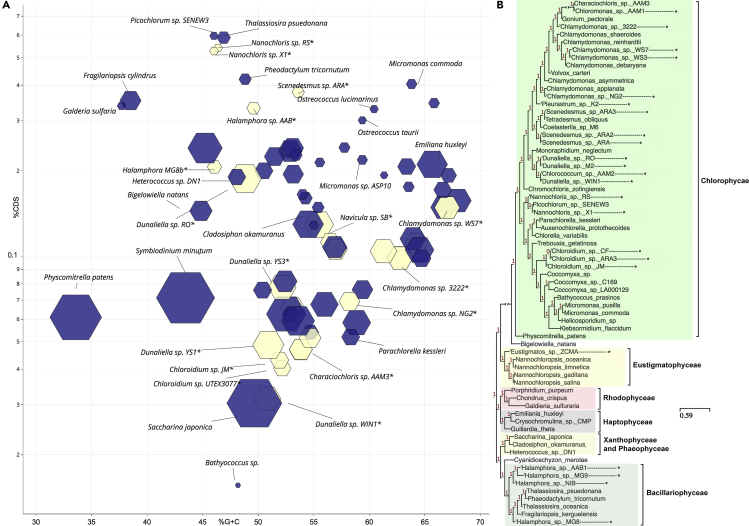
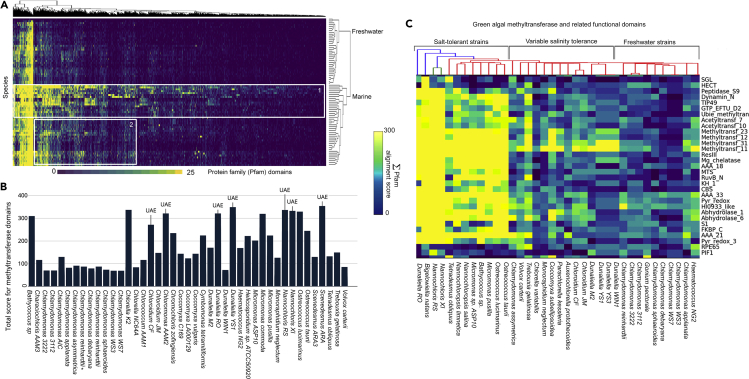
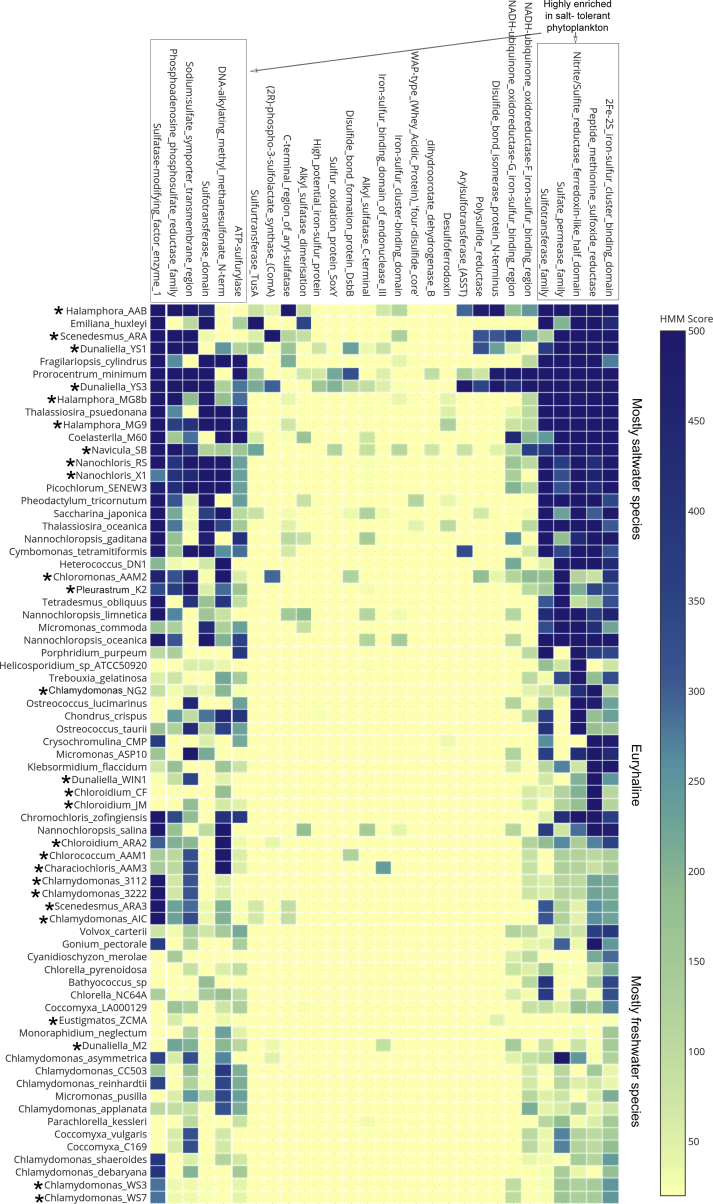
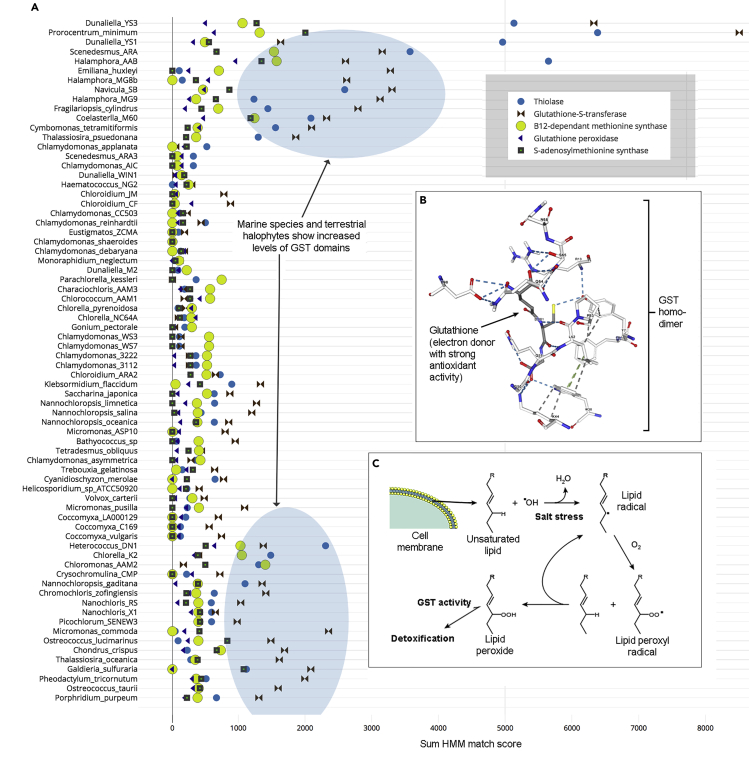
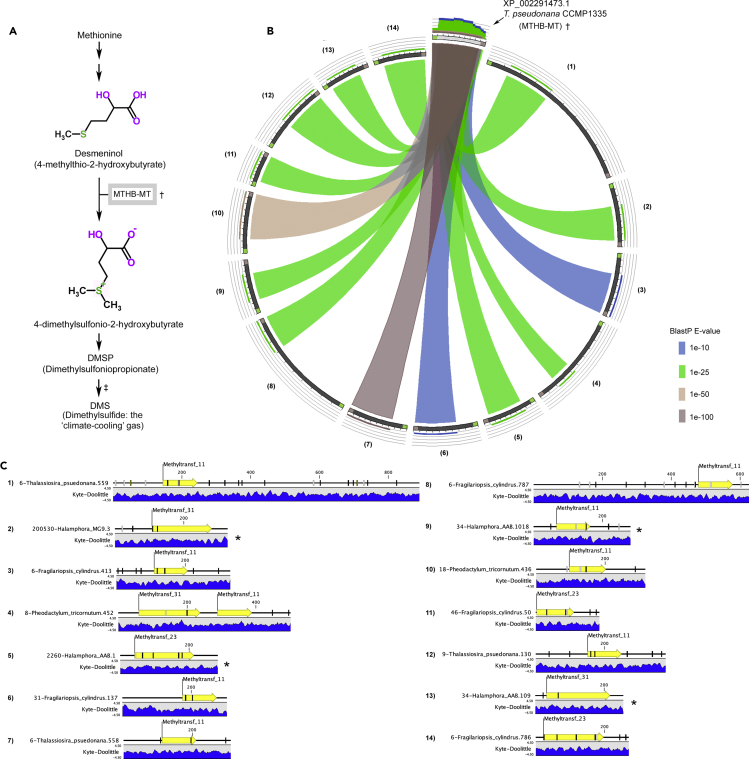
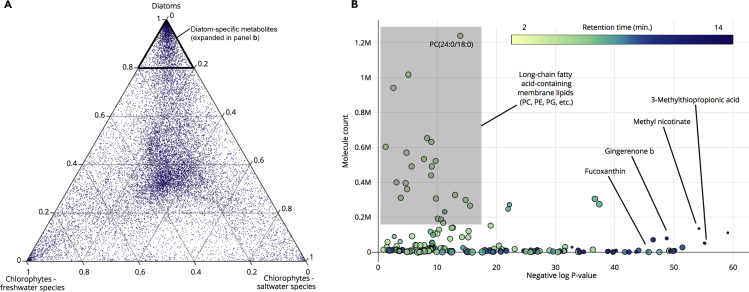
The activities of microalgae support nutrient cycling that helps to sustain aquatic and terrestrial ecosystems. Most microalgal species, especially those from the subtropics, are genomically uncharacterized. Here we report the isolation and genomic characterization of 22 microalgal species from subtropical coastal regions belonging to multiple clades and three from temperate areas. Halotolerant strains including Halamphora, Dunaliella, Nannochloris, and Chloroidium comprised the majority of these isolates. The subtropical-based microalgae contained arrays of methyltransferase, pyridine nucleotide-disulfide oxidoreductase, abhydrolase, cystathionine synthase, and small-molecule transporter domains present at high relative abundance. We found that genes for sulfate transport, sulfotransferase, and glutathione S-transferase activities were especially abundant in subtropical, coastal microalgal species and halophytic species in general. Our metabolomics analyses indicate lineage- and habitat-specific sets of biomolecules implicated in niche-specific biological processes. This work effectively expands the collection of available microalgal genomes by ∼50%, and the generated resources provide perspectives for studying halophyte adaptive traits.

Keywords: Algology; Genomics; Global Nutrient Cycle; Metabolomics.


Figures

None
Graphical abstract
Figure 1
Figure 1
Isolation and Classification of Newly Isolated Microalgal Species (A) Global locations of isolated microalgal species sequenced in this study. (B) Alluvial flow diagram describing the newly isolated microalgal strains regarding their respective clades and isolation locations and environments. (C) Morphology of isolates revealed by bright-field (left) and fluorescent (right) microscopy. Green autofluorescence, observed in right panels, marks the accumulation of intracellular compounds including, but not limited to, flavins, pigments, gaseous molecules, and photoactive proteins.
Figure 2
Figure 2
Genomes and RbcL-Based Phylogenetic Tree Reconstruction of the Isolates (A) Range in size, %G + C content, and %CDS content among eukaryotic microalgae with sequenced genomes. Genomic assemblies presented in this study are marked with asterisks and described in more detail in Table S1. Genomic assemblies from our study (yellow) and NCBI (purple) are compared based on size (hexagon size), %G + C content (x axis), and %CDS (y axis, logarithmic scale). Genomic assembly metrics were obtained using QUAST (Gurevich et al., 2013). (B) Alignment of ribulose-1,5-bisphosphate carboxylase/oxygenase (RbcL) genes and evolutionary model of species presented in this study and the genomic assemblies of microalgae available from NCBI. Asterisks mark the species that we sequenced. A value of “1” at the branch points indicates that the displayed evolutionary model had p < 0.05 when compared with the null model. We downloaded RbcL genes as annotated from their respective assemblies (Data S3). In the case that they were not available, we performed a BLASTn search using the Chlamydomonas reinhardtii RbcL gene (NCBI accession: NC_005353.1) against our predicted CDS set for the organism and extracted the top hit. Sequences, alignment, and tree are in Data S1, and an expanded tree that uses more species' RbcL genes are in Table S1.
Figure 3
Figure 3
Protein Family Domain Analysis in New Microalgal Genomes and Microalgal Genomes Available in Public Databases (A) Complete linkage hierarchical clustering based on the Euclidean distance of protein family domains (Pfams, x axis) and microalgal species (y axis) was performed in R using the heatmap.2 function in the gplot package. Z-depth (color) represents the sum score of hidden Markov model (HMM) alignments for their respective domains. Bounded box 1 represents Pfams from mostly outgroups, including multicellular or specialized, species. Box 2 represents Pfams enriched in marine species compared with freshwater species. (B) An expansion of clustered domains from A, which were significantly enriched in marine and UAE-based species. These domains primarily consisted of methyltransferase domains. (C) HMM alignment scores for all methyltransferase domains, and other domains, including abhydrolase domains, differentially abundant among Chlorophytes. UAE-based strains were among those with the highest copy number, and most significant matches for all methyltransferases, including the Methyltransf_11 domain that is known to interact with S-adenosyl-methionine.
Figure 4
Figure 4
Elevated Sulfur-Related Protein Families (Pfams) in Salt-Tolerant Algae Sulfur-metabolic domains in salt-tolerant algae showed significantly higher sum confidence scores than phytoplankton from the other areas. Asterisks mark species that we present in this article as new genomic assemblies.
Figure 5
Figure 5
Thiol-Related Pfams in Green Microalgal Genomes and Their Possible Role in Salt Stress Tolerance (A) The x axis represents sum Pfam confidence scores, where a score of greater than 100 indicates a strong probability that at least one true functional domain is present. Marine species, including Ostreococcus and Micromonas, had an unusually high copy number of glutathione-S-transferase (GST) domains. Terrestrial halophytes, including Halamphora and Dunaliella species, also shared this elevation in GST domain presence. (B) Protein DataBank (PDB) model for glutathione-S-transferase (http://www.rcsb.org; IAQW; EC: 2.5.1.18; DOI: 10.2210/pdb1AQW/pdb; Prade et al., 1997, Rose et al., 2018) binding to the antioxidant molecule glutathione (GSH) from a representative homodimer form. GST enzymes can also coalesce as heterodimers. (C) Proposed mechanism of membrane lipid oxidation, peroxide formation and propagation, and GST-mediated detoxification, based on studies performed by Balogh and Atkins (2011) showing detoxification of lipid peroxides mediated by GST activity; pathway diagram adapted from a .png file from Young and McEneny (2001) and the cell membrane graphic was adapted from Servier Medical Art, and the use of both graphics are covered under Creative Commons Attribution 3.0.
Figure 6
Figure 6
Circoletto (tools.bat.infspire.org/circoletto/) Plot of Alignment of CDSs within Diatoms (A) Biosynthetic pathway for DMSP and DMS. The † symbol indicates the methylthiohydroxybutyrate methyltransferase (MTHB-MT) presented in Curson et al. (2018). The ‡ symbol indicates the DMSP lyase reaction known to occur in eukaryotic phytoplankton (Arnold et al., 2013) and bacteria (Lei et al., 2018). (B) This alignment shows BLASTp hits (E < 1e-10) with a methylthiohydroxybutyrate methyltransferase (MTHB-MMT) that catalyzes an essential step in DMSP biosynthesis (Kageyama et al., 2018). The plot was made using Circoletto (tools.bat.infspire.org/circoletto/). Translated coding sequences were from our sequenced phytoplankton and publicly accessioned assemblies. Diatom genomes downloaded from NCBI included Phaeodactylum tricornutum, Fragilariopsis cylindrus, and Thalassiosira pseudonana. Diatom genomes sequenced by us and used for this study included Halamphora sp. AAB, Halamphora sp. MG9, and Navicula sp. SB. Although we observed one BLASTp hit within the Navicula sp. SB predicted proteins, the E-value for this hit was above the 1e-10 cutoff (1 × 10−6), and we did not include it in the above diagram. (C) Protein models corresponding to the aligned proteins. Methyltransferase domains, assumed to be the active enzymatic site for the methyltransferase activity, are annotated with yellow arrows. We indicate glycosylation sites as white bars and predicted phosphorylation sites as black bars along the amino acid sequences. Kyle-Doolittle plots, indicating hydrophobicity, are shown below each protein model. We indicate amino acid residues in the numbers on the protein models. For a further expansion on TpMMT BLASTp hits from diatom proteins, see Data S7. A graphical MUSCLE alignment of these amino acid sequences highlighting conserved residues and gap fractions can be found in Figure S2, and InterPro search results in .xml format, as well as graphical .png files, can be found in Data S7.
Figure 7
Figure 7
Extracted Metabolites from Representative Microalgae Species Highlight Diversity among Lineages (Diatoms versus Green Algae) and within Lineages Occupying Different Habitats (Freshwater Green Algae versus Saltwater Green Algae) We performed metabolomics on 14 representative microalgal species. Species and their countries of isolation were Dunaliella sp. YS3 (UAE), Dunaliella sp. YS1 (UAE), Chlamydomonas sp. AIE (ETH), Navicula sp. SB (UAE), Dunaliella sp. RO (UAE), Halamphora sp. MG8 (UAE), Scenedesmus sp. ARA (UAE), Chlorococcum sp. AAM1 (UAE), Eustigmatos sp. ZCMA (UAE), Halamphora sp. MG1 (UAE), Chlorella sp. LF (PT), Pleurastrum sp. K2 (JP), Chloromonas sp. AAM2 (UAE), and Halamphora sp. AAB1 (UAE). All species were cultured in either freshwater or saltwater media for 1 month and underwent extraction using sonication followed by microwave-assisted methanol extraction and filtration. (A) Ternary plot made from pooling the average count for each detected molecular feature (n = 20,618) from three strains for each group. We highlighted metabolites that were uniquely abundant in diatom species with the top, bold-outlined triangle. (B) Molecules that were only contained within diatoms and not the other two groups in A (174 molecules). Statistically significant differences in metabolite abundance were found using two-tailed t tests, and we provide p values adjusted for a false discovery rate of 0.05 (Data S8). Fucoxanthin, a brown pigment, is known to accumulate exclusively in diatoms. However, 3-methylthiopropionic acid is a known methionine metabolism intermediate in other organisms, including humans (Steele, 1978), but among the microalgae in our metabolomics studies, we only observed diatoms accumulating this toxic molecule.

Similar articles

Cited by

References

    1. Alborzi S.Z., Devignes M.D., Ritchie D.W. ECDomainMiner: discovering hidden associations between enzyme commission numbers and Pfam domains. BMC Bioinformatics. 2017;18:107. - PMC - PubMed
    1. Alcolombri U., Ben-Dor S., Feldmesser E., Levin Y., Tawfik D.S., Vardi A. MARINE SULFUR CYCLE. Identification of the algal dimethyl sulfide-releasing enzyme: a missing link in the marine sulfur cycle. Science. 2015;348:1466–1469. - PubMed
    1. Almahasheer H., Serrano O., Duarte C.M., Arias-Ortiz A., Masque P., Irigoien X. Low carbon sink capacity of Red Sea mangroves. Sci. Rep. 2017;7:9700. - PMC - PubMed
    1. Arnold H.E., Kerrison P., Steinke M. Interacting effects of ocean acidification and warming on growth and DMS-production in the haptophyte coccolithophore Emiliania huxleyi. Glob. Chang. Biol. 2013;19:1007–1016. - PubMed
    1. Bach L.T., Alvarez-Fernandez S., Hornick T., Stuhr A., Riebesell U. Simulated ocean acidification reveals winners and losers in coastal phytoplankton. PLoS One. 2017;12:e0188198. - PMC - PubMed

LinkOut - more resources