

Enhanced TGF-β Signaling Contributes to the Insulin-Induced Angiogenic Responses of Endothelial Cells
- PMID: 30684493
- PMCID: PMC6348203
- DOI: 10.1016/j.isci.2018.12.038
Enhanced TGF-β Signaling Contributes to the Insulin-Induced Angiogenic Responses of Endothelial Cells
Abstract
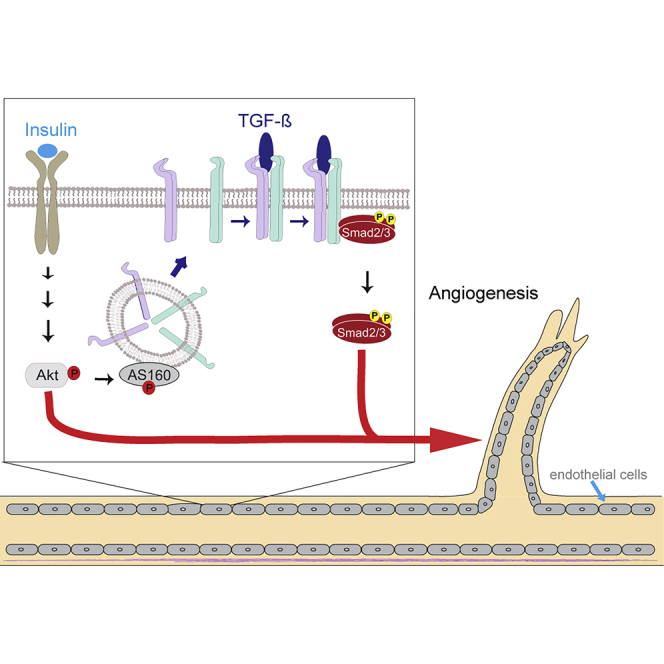
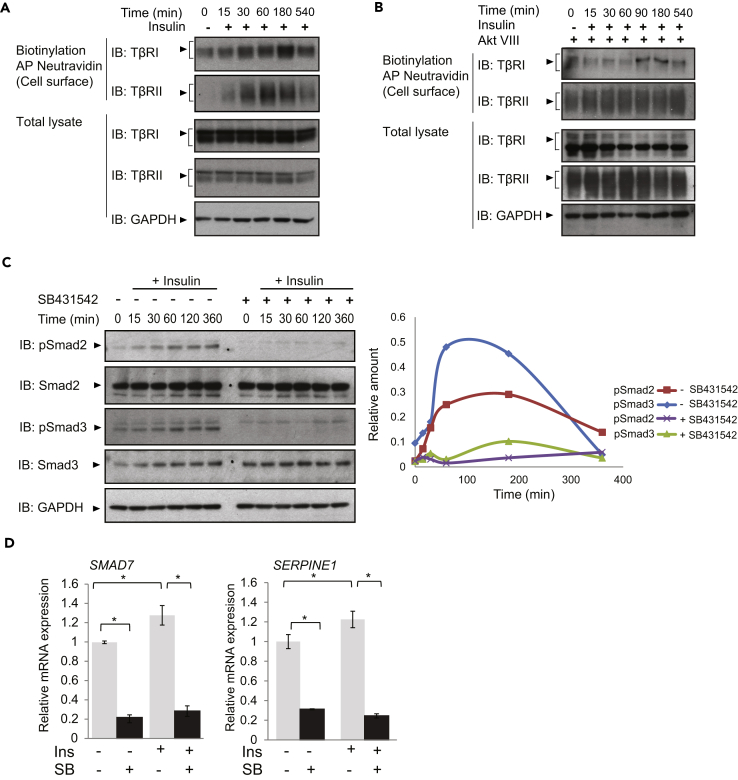
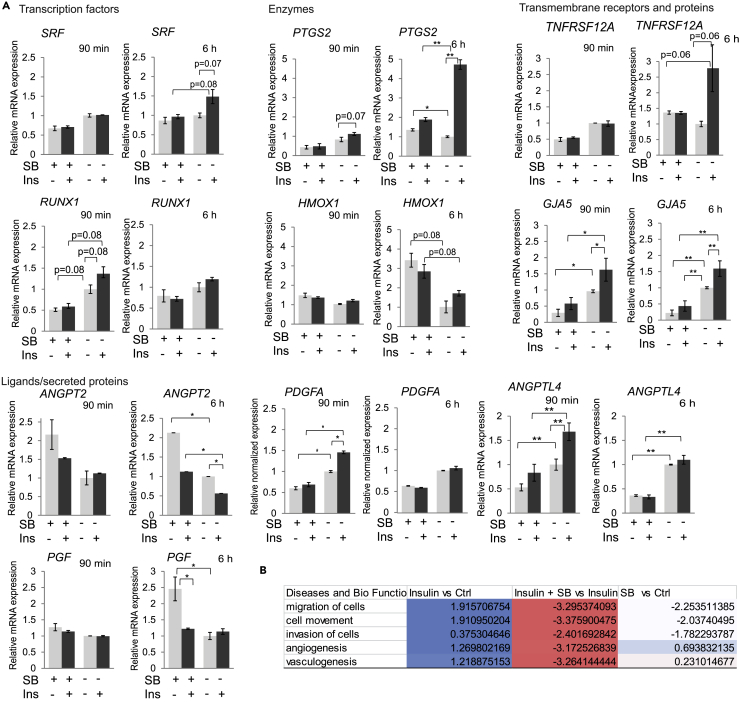
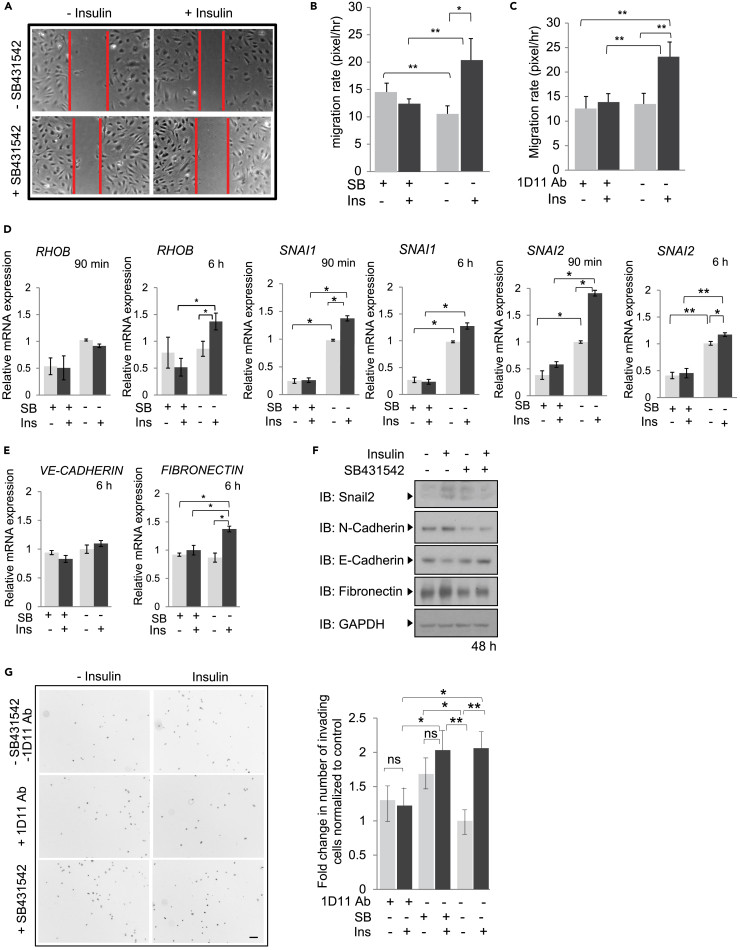
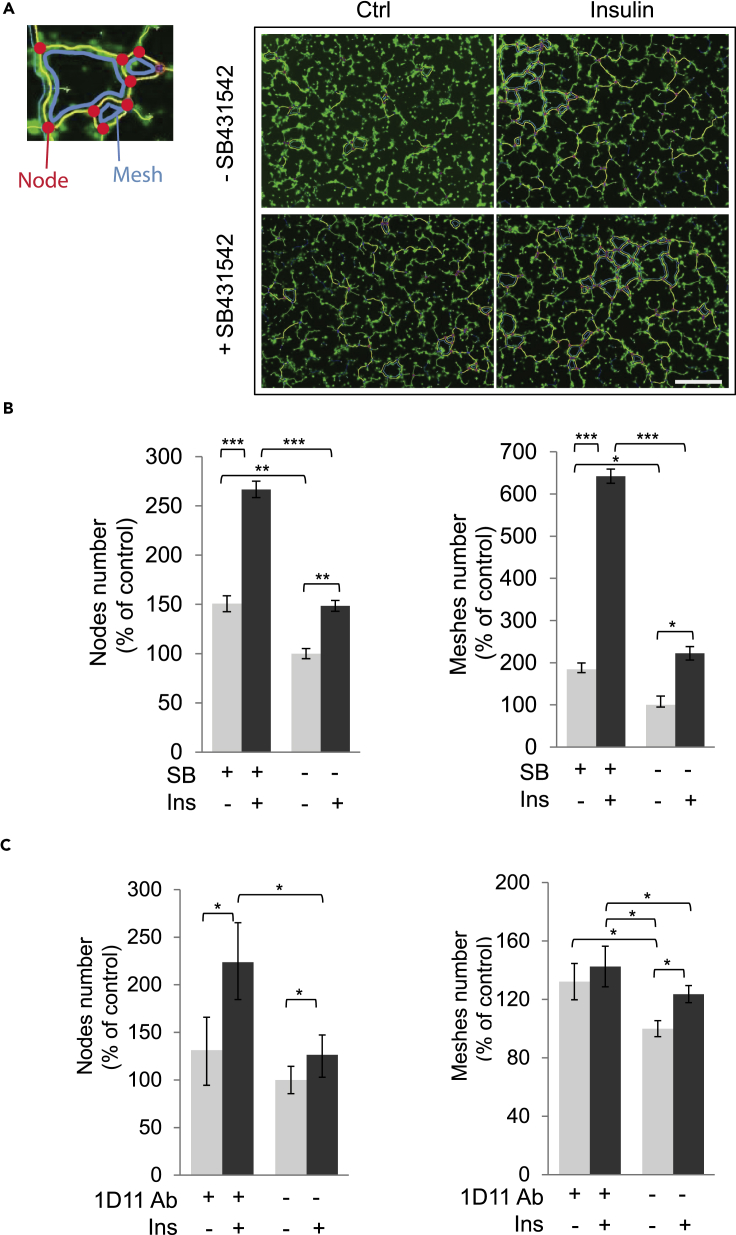
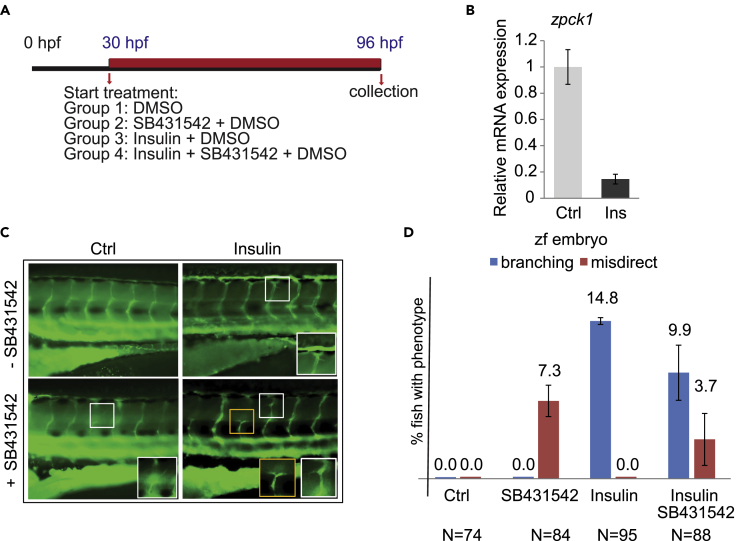
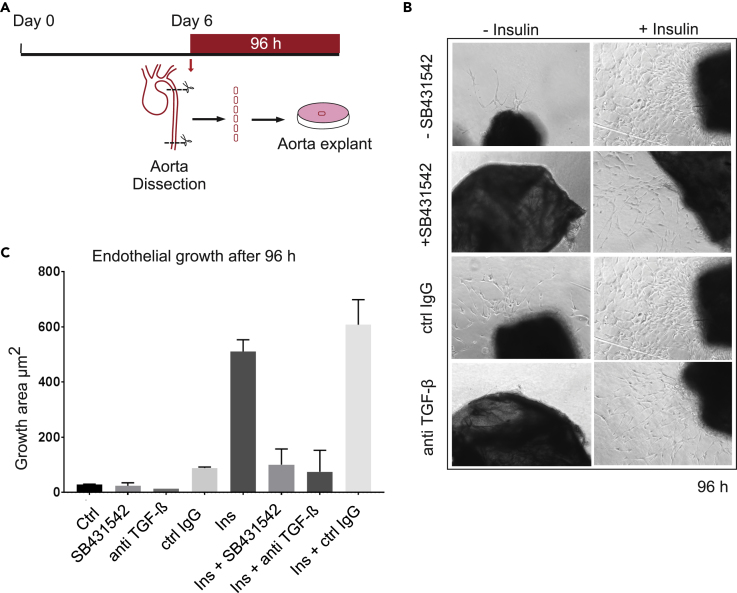
Angiogenesis, the development of new blood vessels, is a key process in disease. We reported that insulin promotes translocation of transforming growth factor β (TGF-β) receptors to the plasma membrane of epithelial and fibroblast cells, thus enhancing TGF-β responsiveness. Since insulin promotes angiogenesis, we addressed whether increased autocrine TGF-β signaling participates in endothelial cell responses to insulin. We show that insulin enhances TGF-β responsiveness and autocrine TGF-β signaling in primary human endothelial cells, by inducing a rapid increase in cell surface TGF-β receptor levels. Autocrine TGF-β/Smad signaling contributed substantially to insulin-induced gene expression associated with angiogenesis, including TGF-β target genes encoding angiogenic mediators; was essential for endothelial cell migration; and participated in endothelial cell invasion and network formation. Blocking TGF-β signaling impaired insulin-induced microvessel outgrowth from neonatal aortic rings and modified insulin-stimulated blood vessel formation in zebrafish. We conclude that enhanced autocrine TGF-β signaling is integral to endothelial cell and angiogenic responses to insulin.
Keywords: Cell Biology; Functional Aspects of Cell Biology; Molecular Biology; Molecular Mechanism of Behavior.
Copyright © 2019 The Author(s). Published by Elsevier Inc. All rights reserved.
Figures
Similar articles
-
Integration of TGF-β-induced Smad signaling in the insulin-induced transcriptional response in endothelial cells.Sci Rep. 2019 Nov 18;9(1):16992. doi: 10.1038/s41598-019-53490-x. Sci Rep. 2019. PMID: 31740700 Free PMC article.
-
EPDR1 is a noncanonical effector of insulin-mediated angiogenesis regulated by an endothelial-specific TGF-β receptor complex.J Biol Chem. 2022 Sep;298(9):102297. doi: 10.1016/j.jbc.2022.102297. Epub 2022 Jul 21. J Biol Chem. 2022. PMID: 35872017 Free PMC article.
-
The insulin response integrates increased TGF-β signaling through Akt-induced enhancement of cell surface delivery of TGF-β receptors.Sci Signal. 2015 Sep 29;8(396):ra96. doi: 10.1126/scisignal.aaa9432. Sci Signal. 2015. PMID: 26420907 Free PMC article.
-
Targeting tumor micro-environment for design and development of novel anti-angiogenic agents arresting tumor growth.Prog Biophys Mol Biol. 2013 Nov;113(2):333-54. doi: 10.1016/j.pbiomolbio.2013.10.001. Epub 2013 Oct 15. Prog Biophys Mol Biol. 2013. PMID: 24139944 Review.
-
Transforming growth factor-beta in cancer and metastasis.Cancer Metastasis Rev. 2006 Sep;25(3):435-57. doi: 10.1007/s10555-006-9006-2. Cancer Metastasis Rev. 2006. PMID: 16951986 Review.
Cited by
-
Transforming growth factor-β receptors: versatile mechanisms of ligand activation.Acta Pharmacol Sin. 2024 Jul;45(7):1337-1348. doi: 10.1038/s41401-024-01235-6. Epub 2024 Feb 13. Acta Pharmacol Sin. 2024. PMID: 38351317 Free PMC article. Review.
-
Advances and Challenges in Targeting TGF-β Isoforms for Therapeutic Intervention of Cancer: A Mechanism-Based Perspective.Pharmaceuticals (Basel). 2024 Apr 20;17(4):533. doi: 10.3390/ph17040533. Pharmaceuticals (Basel). 2024. PMID: 38675493 Free PMC article. Review.
-
Pathophysiology in Brain Arteriovenous Malformations: Focus on Endothelial Dysfunctions and Endothelial-to-Mesenchymal Transition.Biomedicines. 2024 Aug 7;12(8):1795. doi: 10.3390/biomedicines12081795. Biomedicines. 2024. PMID: 39200259 Free PMC article. Review.
-
The Role of TGF-β Signaling Pathways in Cancer and Its Potential as a Therapeutic Target.Evid Based Complement Alternat Med. 2021 Jul 22;2021:6675208. doi: 10.1155/2021/6675208. eCollection 2021. Evid Based Complement Alternat Med. 2021. PMID: 34335834 Free PMC article. Review.
-
Smad transcription factors as mediators of 7 transmembrane G protein-coupled receptor signalling.Acta Pharmacol Sin. 2025 Apr;46(4):795-804. doi: 10.1038/s41401-024-01413-6. Epub 2024 Nov 6. Acta Pharmacol Sin. 2025. PMID: 39506064 Free PMC article. Review.
References
-
- Aoki R., Ikarugi H., Naemura A., Ijiri Y., Yamashita T., Yamamoto J. Endothelial dysfunction precedes atherosclerotic lesions and platelet activation in high fat diet-induced prothrombotic state. Thromb. Res. 2006;117:529–535. - PubMed
-
- Arese M., Serini G., Bussolino F. Nervous vascular parallels: axon guidance and beyond. Int. J. Dev. Biol. 2011;55:439–445. - PubMed
-
- Arnaoutova I., Kleinman H.K. In vitro angiogenesis: endothelial cell tube formation on gelled basement membrane extract. Nat. Protoc. 2010;5:628–635. - PubMed
-
- Babapoor-Farrokhran S., Jee K., Puchner B., Hassan S.J., Xin X., Rodrigues M., Kashiwabuchi F., Ma T., Hu K., Deshpande M. Angiopoietin-like 4 is a potent angiogenic factor and a novel therapeutic target for patients with proliferative diabetic retinopathy. Proc. Natl. Acad. Sci. U S A. 2015;112:E3030–E3039. - PMC - PubMed
Grants and funding
LinkOut - more resources
Full Text Sources
Molecular Biology Databases
