. 2019 Apr 1:189:497-515.
doi: 10.1016/j.neuroimage.2019.01.038. Epub 2019 Jan 23.

Generalized diffusion spectrum magnetic resonance imaging (GDSI) for model-free reconstruction of the ensemble average propagator

Affiliations

Generalized diffusion spectrum magnetic resonance imaging (GDSI) for model-free reconstruction of the ensemble average propagator

Qiyuan Tian et al. Neuroimage. .

Abstract

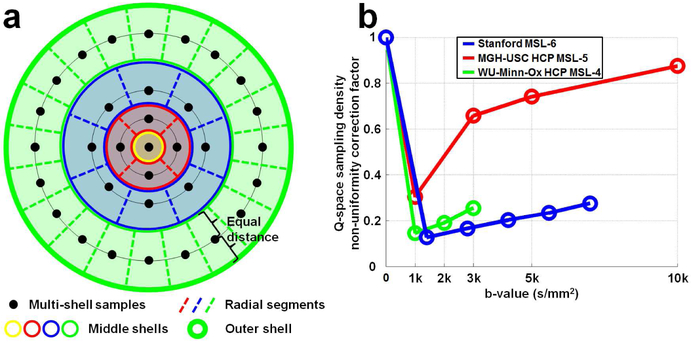
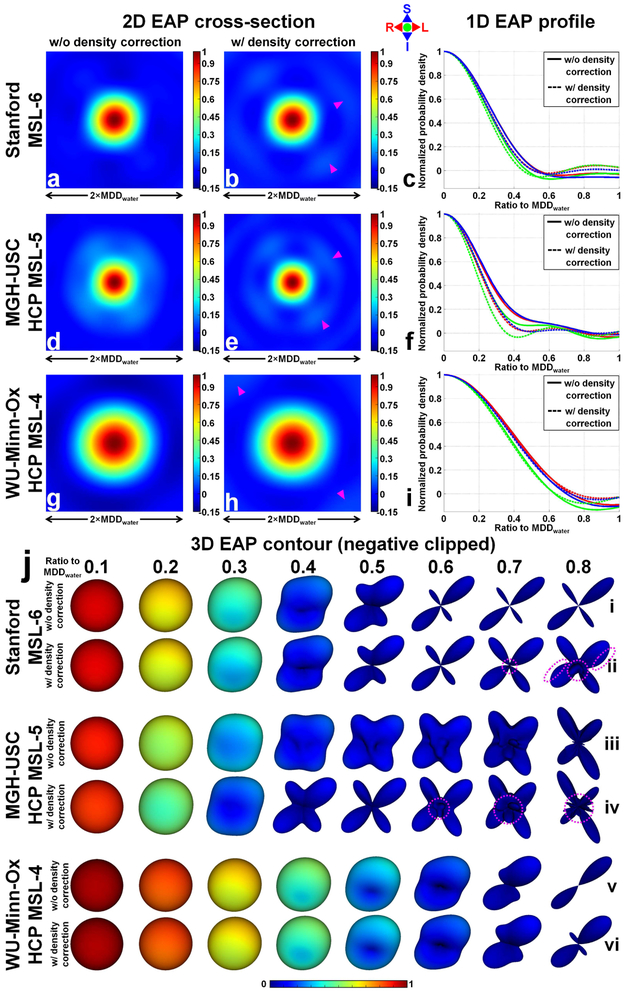
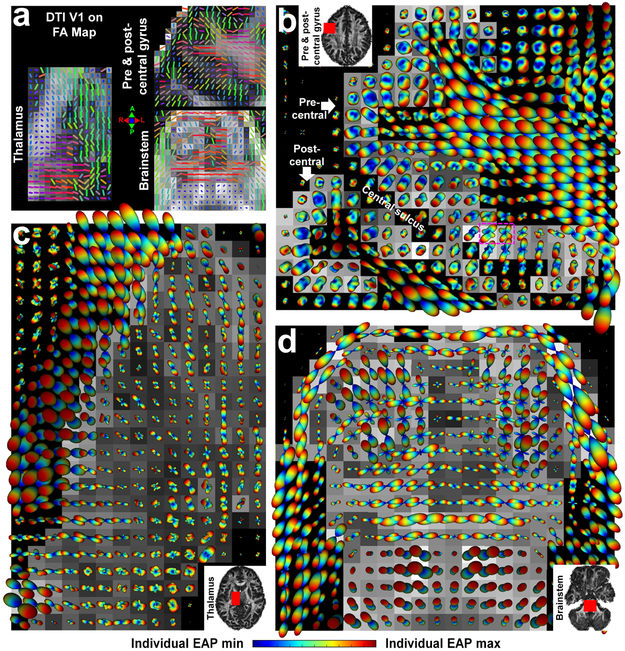
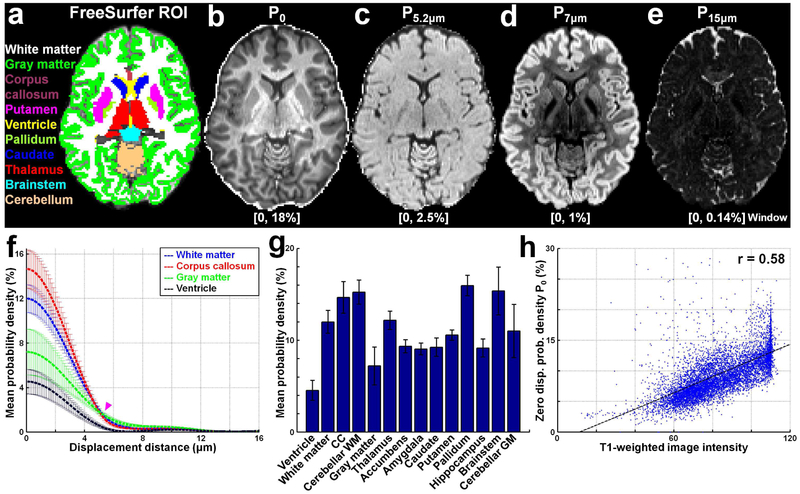
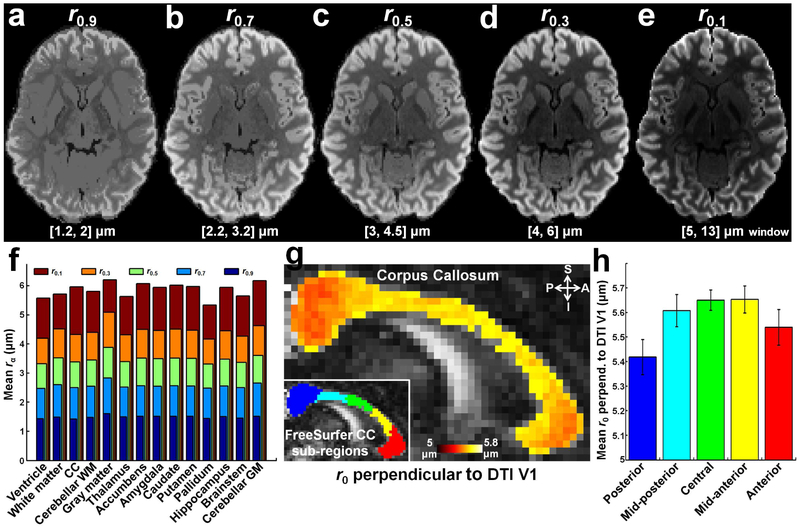
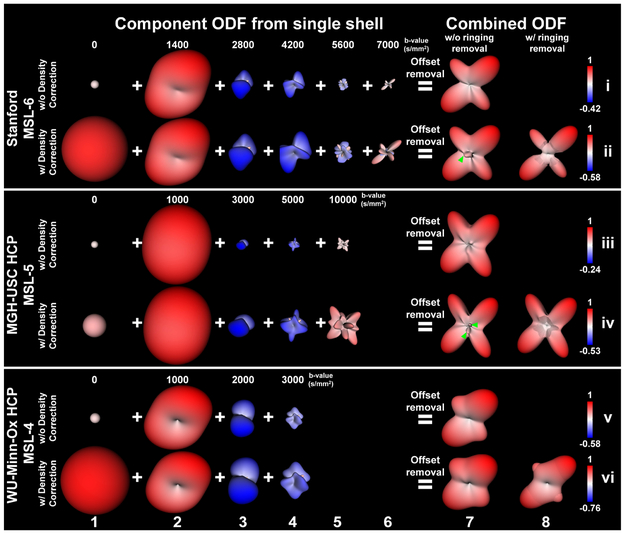
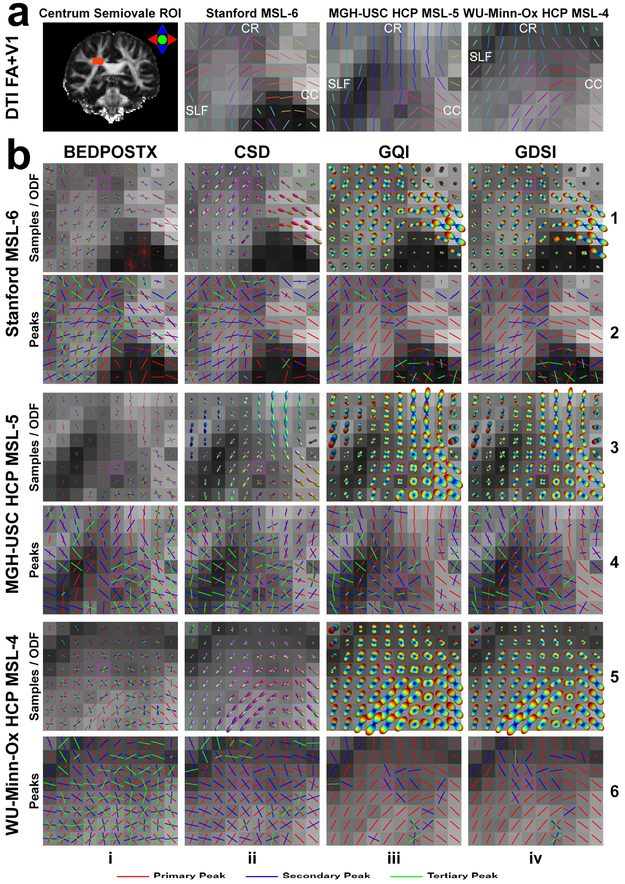
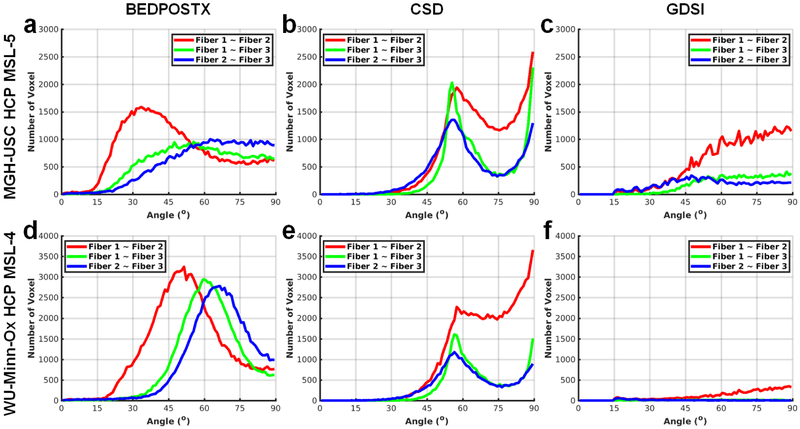
Diffusion spectrum MRI (DSI) provides model-free estimation of the diffusion ensemble average propagator (EAP) and orientation distribution function (ODF) but requires the diffusion data to be acquired on a Cartesian q-space grid. Multi-shell diffusion acquisitions are more flexible and more commonly acquired but have, thus far, only been compatible with model-based analysis methods. Here, we propose a generalized DSI (GDSI) framework to recover the EAP from multi-shell diffusion MRI data. The proposed GDSI approach corrects for q-space sampling density non-uniformity using a fast geometrical approach. The EAP is directly calculated in a preferable coordinate system by multiplying the sampling density corrected q-space signals by a discrete Fourier transform matrix, without any need for gridding. The EAP is demonstrated as a way to map diffusion patterns in brain regions such as the thalamus, cortex and brainstem where the tissue microstructure is not as well characterized as in white matter. Scalar metrics such as the zero displacement probability and displacement distances at different fractions of the zero displacement probability were computed from the recovered EAP to characterize the diffusion pattern within each voxel. The probability averaged across directions at a specific displacement distance provides a diffusion property based image contrast that clearly differentiates tissue types. The displacement distance at the first zero crossing of the EAP averaged across directions orthogonal to the primary fiber orientation in the corpus callosum is found to be larger in the body (5.65 ± 0.09 μm) than in the genu (5.55 ± 0.15 μm) and splenium (5.4 ± 0.15 μm) of the corpus callosum, which corresponds well to prior histological studies. The EAP also provides model-free representations of angular structure such as the diffusion ODF, which allows estimation and comparison of fiber orientations from both the model-free and model-based methods on the same multi-shell data. For the model-free methods, detection of crossing fibers is found to be strongly dependent on the maximum b-value and less sensitive compared to the model-based methods. In conclusion, our study provides a generalized DSI approach that allows flexible reconstruction of the diffusion EAP and ODF from multi-shell diffusion data and data acquired with other sampling patterns.

Keywords: Diffusion spectrum imaging; Ensemble average propagator; Model-free; Multi-shell acquisition; Orientation distribution function; Q-space imaging; Sampling density non-uniformity correction.


Figures

Figure Appendix B.
Figure Appendix B.
2D illustration of a q-space sampling shell of q-value q. Radial lines ob and od define the cone associated with the q-space sample c. The distance between two samples (ac) is equal to the distance bd (=2 · qsinθ).
Figure 1.
Figure 1.
The reconstruction matrix R0,1,0(qz) and R0,1,2(qz) for computing the orientation distribution function value along qz-axis (bottom to top) with parameters λs=0, λe= 1, n=0 (a, b, e) and λs =0, λe=1, n=2 (c, d, f). R0,1,0(qz) and R0,1,2(qz) are displayed as 1D profile along the qz-axis (a, c), 2D cross-section on the qy-qz plane (b, d), and 3D contour at single q(b)-values (e, f). The green dots display the standard DSI-11 Cartesian q-space sampling locations with 7000 s/mm2 maximum b-value.
Figure 2.
Figure 2.
Comparison of ensemble average propagator (EAP) (a, b) and orientation distribution function (ODF) (d-e) recovered from fast Fourier transform (FFT)-based diffusion spectrum imaging (DSI) (a, d) and proposed matrix formalism-based (q-space imaging) QSI reconstruction (b, e, f) on a simulated noise-free three-fiber-crossing DSI-11 voxel. For both methods, the ODFs are reconstructed with λs =0, λe=1, n=2. The ODF from the indirect QSI approach (f) was computed with the negative values of the EAP clipped to 0, the practice used in DSI reconstruction. The EAP and ODF are normalized by their maximum values. The scatter plots (c, g, h) depict 500 randomly selected values, with correlation from all values reported. The pink arrows highlight a region on ODF that demonstrates the effects of clipping negative values in EAP to 0 on the consequently reconstructed ODF.
Figure 3.
Figure 3.
Decomposition of the orientation distribution function (ODF) from the simulated noise-free three-fiber-crossing voxel (d) acquired using a standard diffusion spectrum imaging acquisition with 11×11×11 Cartesian grid and 7000 s/mm2 maximum b-value into component ODFs (c) from the 515 q-space signals (a), and component ODFs (e) from q-space signals with different maximum b-values (the six b-values along the left-right axis, i.e. 0, 280 s/mm2, 1120 s/mm2, 2520 s/mm2, 4480 s/mm2, 7000 s/mm2). The q-space signals in (a) are arranged from low to high b-value in a 2D matrix (left to right, top to bottom). Each component ODF in (c) is the impulse response ODF (b) weighted by the diffusion signal intensity measured at the correspondent q-space location. The size of the impulse response ODF (b), component ODF (c, e) is proportional to the ODF value.
Figure 4.
Figure 4.
A 2D illustration of the proposed geometrical approach to estimate the q-space sampling density correction factor, i.e. the volume associated with each q-space sample, assuming q-space samples are uniformly distributed on each shell (a), and the estimated results at each shell for the Stanford (b, blue curve), MGH-USC HCP (b, red curve) and WU-Minn-Ox HCP data (b, green curve). Four shells are depicted (including the origin) for illustration purpose. Note in (b) the x-axis is specified in b-value, which is square of the corresponding q-value.
Figure 5.
Figure 5.
Reconstructed spin displacement ensemble average propagator (EAP) with (b, e, h, dashed lines in c, f, i, and rows ii, iv, vi in j) and without (a, d, g, solid lines in c, f, i, and rows i, iii, v in j) q-space sampling density correction of crossing-fiber voxels (Fig. 10 green dashed boxes) from the Stanford (a-c, row i and ii in j), MGH-USC HCP (d-f, rows iii and iv in j) and WU-Minn-Ox HCP data (g-i, rows v and vi in j). The 2D coronal cross sections through the center of the 3D EAP (a, b, d, e, g, h), the 1D profiles along left-right (L-R, red lines in c, f, i), superior-inferior (S-I, blue lines in c, f, i) and anterior-posterior (A-P, green lines in c, f, i) directions from the EAP center, and the 3D contours (j, negative values clipped to 0) at different displacement distances are displayed. The mean displacement distance of free water (MDDwater) given the experimental timing is 23.7 μm, 16.2 μm, and 24.4 μm for the Stanford, MGH-USC HCP and WU-Minn-Ox HCP data respectively. The EAPs are normalized by their maximum values (i.e. the value at the EAP center). The pink arrows and dashed circles highlight the positive side lobes of the Gibbs ringing.
Figure 6.
Figure 6.
Spin displacement ensemble average propagators (EAPs) recovered at 8 μm (with q-space sampling density correction) from the pre- and post-central gyrus, thalamus and brainstem regions of interest (ROIs, red rectangles in the inset images in b-d) from the MGH-USC HCP data overlaid on axial slices of fractional anisotropy (FA) maps (windowed between [0, 1]) from diffusion tensor imaging (DTI) (b-d). The nearby voxels outside the gray matter, thalamus and brainstem within the ROIs are on top of black background. The FA and the primary eigenvectors (V1) from DTI of the three ROIs are displayed in (a). DTI V1 is color coded based on orientation (red: left-right, green: anterior-posterior, blue: superior-inferior).
Figure 7.
Figure 7.
Maps of the mean probability at 0 (b), 5.2 μm (c), 7 μm (d) and 15 μm (e) displacement distance on a representative axial slice, and the mean and standard deviation of the mean probability (f, g) within 14 FreeSurfer regions of interest (ROIs) (a, listed along the x-axis in g) from the MGH-USC HCP data. The scatter plot of the zero-displacement probability versus the T1-weighted image intensity in the whole brain is showed with the correlation value (h).
Figure 8.
Figure 8.
Maps of the displacement distance at 0.9 (a), 0.7 (b), 0.5 (c), 0.3 (d), and 0.1 (e) of the zero displacement probability (P0) on a representative axial slice, and their mean within 14 FreeSurfer region of interests (ROIs) (Fig. 7a, listed along the x-axis in f) from the MGH-USC HCP data. The map of the displacement distance at 0 probability (r0, distance at first zero crossing) perpendicular to the primary eigenvector (V1) from diffusion tensor imaging (DTI) in the corpus callosum (CC) is displayed on fractional anisotropy (FA) map (windowed between [0, 1]) from DTI on a representative sagittal slice. The mean and standard deviation of r0 within the five sub-regions of the CC (the anterior (red in g inset), mid-anterior (yellow in g inset), central (green in g inset), mid-posterior (cyan in g inset) and posterior (blue in g inset)) are reported in (h). Only voxels with FA larger than 0.5 within the FreeSurfer CC ROI are included.
Figure 9.
Figure 9.
Component orientation distribution functions (ODFs) from single shell (columns 1-6) and combined ODF (columns 7, 8) reconstructed with (rows ii, iv, vi) and without (rows i, iii, v) q-space sampling density correction, with (column 8) and without (column 7) ensemble average propagator (EAP) ringing removal for the Stanford (rows i, ii), MGH-USC HCP (rows iii, iv) and WU-Minn-Ox HCP data (rows v, vi). The size of the component ODF is proportional to their value. The size of the component ODF from the b=1000 s/mm2 shell is kept the same with and without q-space sampling density correction. The combined ODF is normalized by their maximum.
Figure 10.
Figure 10.
Reconstructed fiber orientation samples (b, rows 1, 3, 5, columns i, 15 randomly selected samples, stick length proportional to the fiber volume fraction) and the average orientation (b, rows 2, 4, 6, columns i) from the BEDPOSTX method, and the orientation distribution function (ODF) (b, rows 1, 3, 5, columns ii-iv) and the ODF peaks (b, rows 2, 4, 6, columns ii-iv) from the multi-shell multi-tissue constrained spherical deconvolution (CSD) method, generalized q-space imaging (GQI), and the proposed generalized diffusion spectrum imaging (GDSI) method in the centrum semiovale region (a) from the Stanford (b, rows 1, 2), MGH-USC HCP (b, rows 3, 4) and WU-Minn-Ox HCP data (b, rows 5, 6). The primary eigenvectors (V1) from diffusion tensor imaging (DTI) are also depicted (a). All reconstruction results are displayed on top of the DTI fraction anisotropy (FA) map (windowed between 0 and 1). The diffusion ODF (b, rows 1, 3, 4, columns iii and iv) is color coded with the minimum as blue and the maximum as red. The red, blue and green vectors from the ODF peaks and BEDPOSTX (b, rows ii, iv, vi) represent the primary, secondary and tertiary diffusion orientations, respectively. DTI V1 and the fiber ODF (b, rows 1, 3, 4, columns ii) is color coded based on orientation (red: left-right, green: anterior-posterior, blue: superior-inferior). The centrum semiovale region contains intersection of the corpus callosum (CC), the corona radiata (CR), and the superior longitudinal fasciculus (SLF). The magenta dashed boxes indicate the crossing-fiber voxels presented in Figures 5 and 9.
Figure 11.
Figure 11.
Histograms of the angles between the primary, secondary and tertiary fiber orientations identified by the BEDPOSTX method (a, d), the multi-shell multi-tissue constrained spherical deconvolution (CSD) method (b, e), and the proposed generalized diffusion spectrum imaging (GDSI) method from the MGH-USC HCP (a-c) and WU-Minn-Ox HCP (d-f) multi-shell data. The histograms only include white matter voxels with both the primary and secondary fibers (red curves), both the primary and tertiary fibers (green curves) and both the secondary tertiary fibers (blue curves). The area under the red, green and blue curves is equal to the nur of the secondary fibers, tertiary fibers and tertiary fibers, respectively.

References

    1. Einstein A Über die von der molekularkinetischen Theorie der Wärme geforderte Bewegung von in ruhenden Flilssigkeiten suspendierten Teilchen. Annalen der physik. 1905;322(8):549–60.
    1. Stejskal E, Tanner J. Spin diffusion measurements: spin echoes in the presence of a time - dependent field gradient. The journal of chemical physics. 1965;42(l):288–92.
    1. Stejskal E Use of spin echoes in a pulsed magnetic - field gradient to study anisotropic, restricted diffusion and flow. The Journal of Chemical Physics. 1965;43(10):3597–603.
    1. Kärger J, Eleink W. The propagator representation of molecular transport in microporous crystallites. Journal of Magnetic Resonance (1969). 1983. ;51 (1): 1–7.
    1. Cory D Measurement of translational displacement probabilities by NMR: an indicator of compartmentation. Magnetic resonance in medicine. 1990; 14(3):435–44. - PubMed

Publication types

MeSH terms