. 2019 Feb:21:101068.
doi: 10.1016/j.redox.2018.101068. Epub 2018 Dec 6.

Adropin protects against liver injury in nonalcoholic steatohepatitis via the Nrf2 mediated antioxidant capacity

Affiliations

Adropin protects against liver injury in nonalcoholic steatohepatitis via the Nrf2 mediated antioxidant capacity

Xu Chen et al. Redox Biol. 2019 Feb.

Abstract

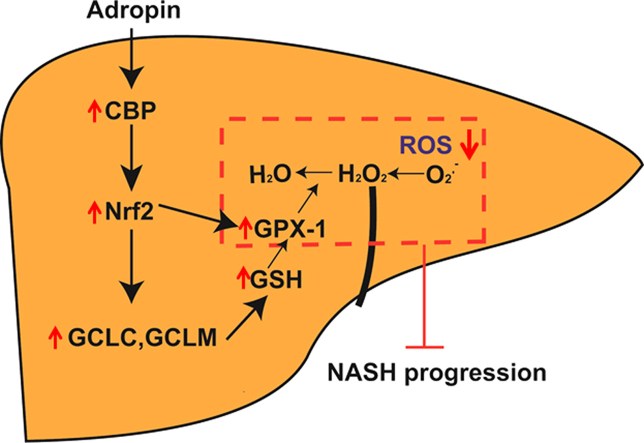
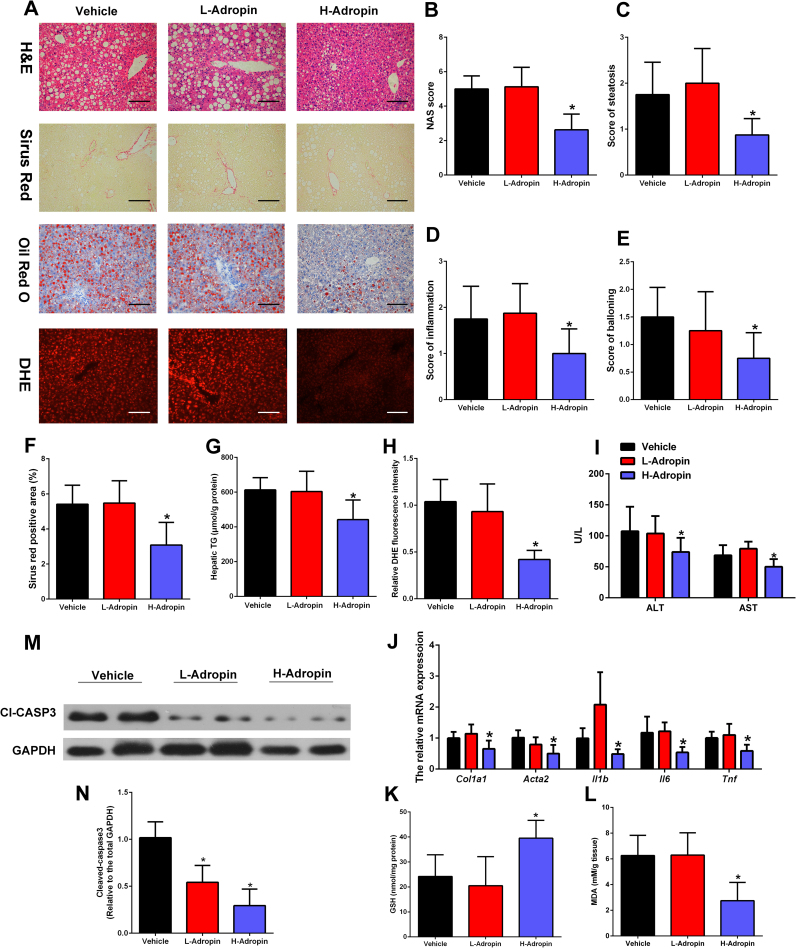
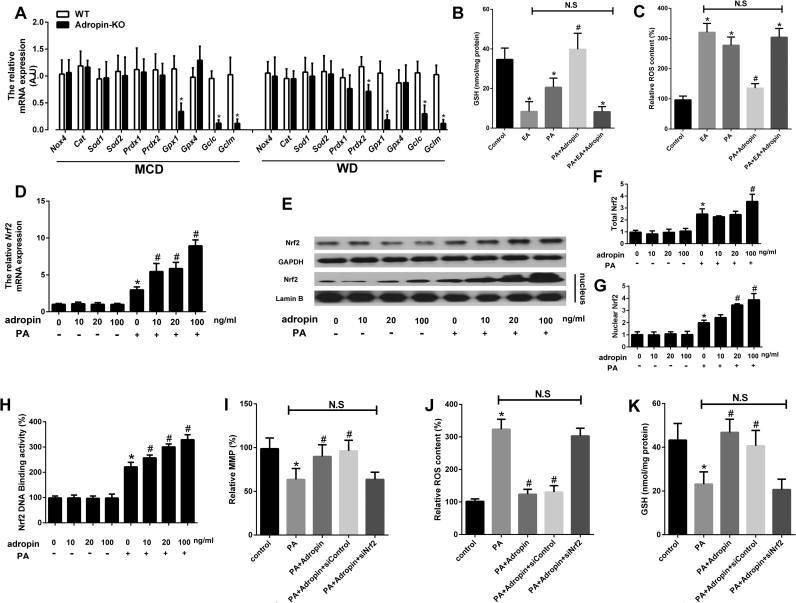
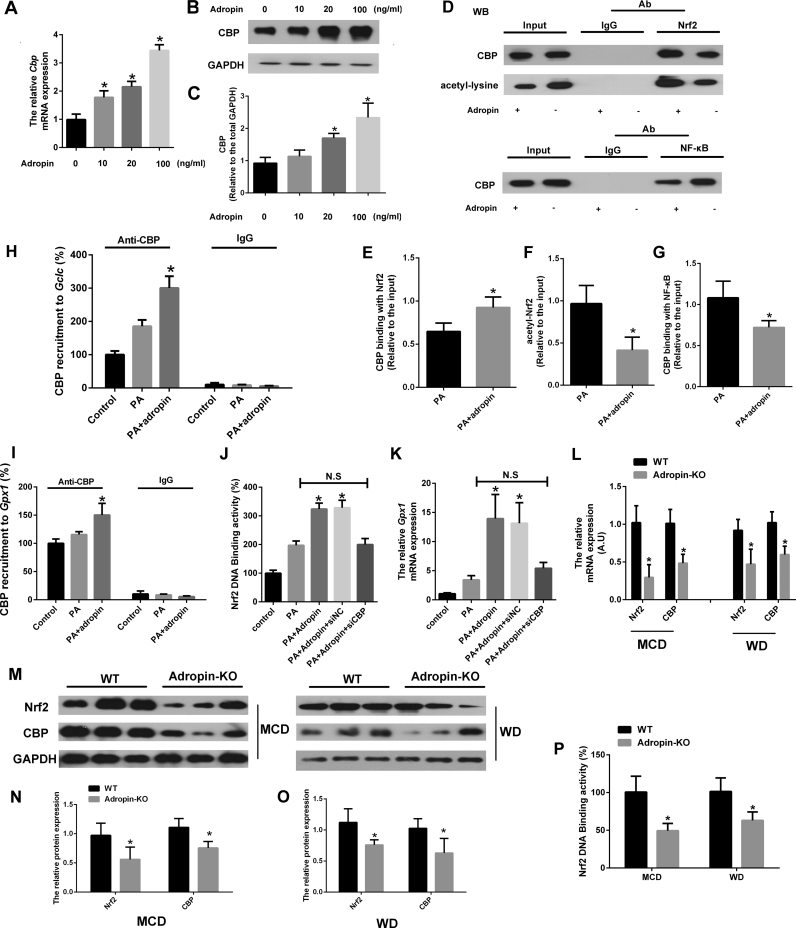
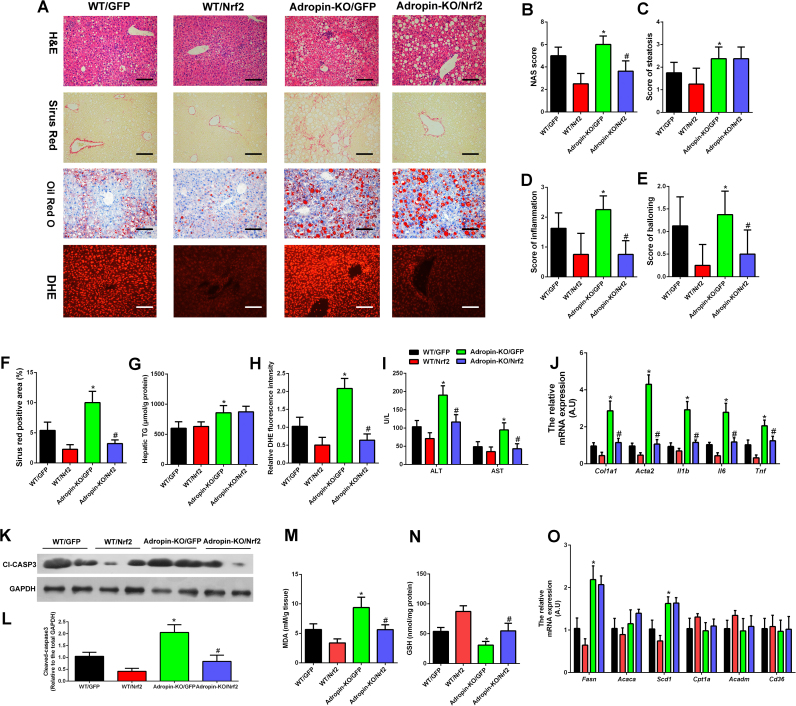
Adropin, a secretory signal peptide, has shown beneficial effects on improving glucose homeostasis and dyslipidemia. However, whether this peptide affects nonalcoholic steatohepatitis (NASH) has remained unclear. In this study, the serum adropin levels, liver injury and oxidative stress were measured in diet-induced NASH mice. Adropin knock-out mice and palmitate treated primary hepatic cells were used to investigate the influence of adropin on liver injury. Our results show that serum adropin levels were decreased and negatively correlated with liver injury in NASH mice. Knockout of adropin significantly exacerbated hepatic steatosis, inflammatory responses and fibrosis in mice after either methionine-choline deficient diet (MCD) or western diet (WD) feeding. And the treatment with adropin bioactive peptides ameliorated NASH progression in mice. Adropin alleviated hepatocyte injury by upregulating the expression of Gclc, Gclm, and Gpx1 in a manner dependent on Nrf2 transcriptional activity and by increasing the glutathione (GSH) levels. And adropin significantly increased CBP expression and promoted its binding with Nrf2, which enhanced Nrf2 transcriptional activity. Furthermore, AAV8-mediated overexpression of hepatic Nrf2 expression functionally restored the liver injury induced by adropin-deficiency MCD-fed mice. These findings provide evidence that adropin activates Nrf2 signaling and plays a protective role in liver injury of NASH and therefore might represent a novel target for the prevention and treatment of NASH.

Keywords: GSH; Lipotoxicity; NASH; Nrf2; ROS.


Figures

fx1
Graphical abstract
Fig. 1
Fig. 1
Dynamics of serum adropin levels changed in mice fed with NASH diet. Eight-week-old male C57BL/6J mice were fed with MCD diet or WD diet for 8 or 16 weeks. (A) Respresentative liver H&E, sirus red, DHE and TUNEL staining (magnification, ×200), scale bar: 200 µm. (B-E) Hepatic histological analysis of H&E staining. (F) Quantitative analysis of Sirius Red staining. (G) Quantitative analysis of DHE staining. (H) Quantitative analysis of TUNEL staining. (I) The liver MDA contents. (J-K) Cleaved caspase-3 expression of total liver lysates from NASH diet–fed mice. (L) Serum Adropin levels. (M) Correlation of serum ALT with serum adropin levels. (N) Correlation of liver MDA contents with serum adropin levels. (G, K) Control diet group was set as 1. The data are expressed as the mean ± SD, n = 8, * P < 0.05 versus the control diet group.
Fig. 2
Fig. 2
NASH pathological changes were exacerbated by knock-out of adropin in mice. Adropin-KO mice and the wild type (WT) littermate were fed with MCD or WD for 4 or 16 weeks. (A) H&E, Sirius Red and Oil Red O staining of liver sections (magnification, ×200), scale bar: 200 µm. (B-E) Hepatic histological analysis of H&E staining. (F) Quantitative analysis of Sirius Red staining. (G) Hepatic TG contents. (H) Serum ALT and AST levels. (I) The mRNA expression of Col1a1 and Acta2 in the liver. (J) The mRNA expression of Il1b, Il-6 and Tnf in the liver. (I, J) WT control group was set as 1. The data are expressed as the mean ± SD, n = 6, * P < 0.05 versus WT control.
Fig. 3
Fig. 3
NASH diet induced liver oxidative stress was exaggerated in adropin-KO mice. Adropin-KO mice and the wild type (WT) littermate were fed with MCD or WD for 4 or 16 weeks. (A) DHE and TUNEL staining of liver sections (magnification, ×200), scale bar: 200 µm. (B) Quantitative analysis of DHE staining. (C) Quantitative analysis of TUNEL staining. (D) The liver MDA contents. (E) The liver GSH levels. (F-G) Cleaved caspase-3 expression of total liver lysates. (B, G) WT control group was set as 1. The data are expressed as the mean ± SD, n = 6, * P < 0.05 versus WT control.
Fig. 4
Fig. 4
The bioactive adropin peptide ameliorated the liver injury in MCD-fed mice. C57BL/6 J mice were fed an MCD for four weeks and administered intraperitoneal (i.p.) injections of vehicle, low-dose adropin (34−76) (50 nmol/kg/i.p.), or high-dose adropin (500 nmol/kg/i.p.) for one week. (A) Representative liver histology (H&E staining, Sirius Red, Oil Red O and DHE staining) (magnification, ×200), scale bar: 200 µm. (B-E) Hepatic histological analysis of H&E staining. (F) Quantitative analysis of Sirius Red staining. (G) Hepatic TG contents. (H) Quantitative analysis of DHE staining. (I) Serum ALT and AST levels. (J) The mRNA expression of Col1a1, Acta2, Il1b, Il-6 and Tnf in the liver. (K) The liver MDA levels. (L) The liver GSH levels. (M-N) Cleaved caspase-3 expression of total liver lysates. (H, J, N) Vehicle control group was set as 1. The data are expressed as the mean ± SD, n = 8, * P < 0.05 versus control group.
Fig. 5
Fig. 5
Adropin induced antioxidant reaction and activated the Nrf2 pathway. (A) Adropin-KO mice and the wild type (WT) littermate were fed with MCD or WD for 4 or 16 weeks. The mRNA expression of antioxidant related genes were measured. WT control group was set as 1. The data are expressed as the mean ± SD, n = 6, * P < 0.05 versus WT control. Primary murine hepatocytes preloaded with PA (400 µM) were treated with or without adropin (100 ng/ml) or ethacrynic acid (EA) (2 mg/ml) for 24 h. The intracellular GSH levels (B) and the relative ROS content (C) were measured. Primary murine hepatocytes pretreated with PA (400 µM) were treated with adropin at different dosages (0–100 ng/ml) for 24 h. The mRNA expression of Nrf2 (D), the protein expression of Nrf2 (E-G) and the Nrf2 transcription activity (H) were measured. Primary murine hepatocytes preloaded with PA (400 µM) were treated with or without adropin (100 ng/ml) and transfected with or without Nrf2 siRNA for 24 h. And the relative MMP (I), intracellular ROS content (J) and GSH levels (K) were measured. (C, D, F, G, H, I, J) Blank control group was set as 1. The data are expressed as the mean ± SD (n = 3–5, * P < 0.05 versus blank control group; # P < 0.05 versus PA-treatment group).
Fig. 6
Fig. 6
Adropin increased CBP expression and its binding with Nrf2 to enhance Nrf2 transcriptional activity. Primary murine hepatocytes pretreated with PA (400 µM) were treated with adropin at different dosages (0–100 ng/ml) for 24 h. The mRNA expression of Cbp (A) and the protein expression of CBP (B-C) were measured. CBP-Nrf2 and CBP-NFκB interactions were studied by immunoprecipitation (IP) in the hepatocytes treated with or without adropin (100 ng/ml) (D-G). Chromatin immunoprecipitation (ChIP) assays were performed to investigate the presence of CBP at the antioxidant response element (ARE) sites on the promoters of Gclc (H) and Gpx1 (I) in the hepatocytes treated with or without adropin (100 ng/ml). Primary murine hepatocytes pretreated with PA (400 µM) were treated with or without adropin (100 ng/ml) and transfected with CBP siRNA or control for 24 h. And the DNA-binding activity of Nrf2 (J) and the mRNA expression of Gpx1 (K) were measured. (A, C, E, F, G) PA-treated group was set as 1. (H, I, J, K) Blank control group was set as 1. The data are expressed as the mean ± SD, n = 3–5, *P < 0.05 versus PA-treatment group. NC indicates negative control. N.S indicates no significance. Adropin-KO mice and the wild type (WT) littermate were fed with MCD or WD for 4 or 16 weeks. The mRNA (L) and protein expression (M-O) of Nrf2 and Cbp were measured. And the liver lysates DNA-binding activity of Nrf2 was detected (P). (L, N, O, P) WT control group was set as 1. The data are expressed as the mean ± SD, n = 6, *P < 0.05 versus WT control.
Fig. 7
Fig. 7
Overexpression of hepatic Nrf2 expression functionally restored the liver injury induced by adropin-deficiency in mice. WT and Adropin-KO male mice fed MCD for 4 weeks. AAV8-GFP and AAV8–Nrf2 vectors were administered following the initiation of MCD feeding. (A) H&E, Sirius Red, Oil Red O, and DHE staining of liver sections (magnification, ×200), scale bar: 200 µm. (B-E) Hepatic histological analysis of H&E staining. (F) Quantitative analysis of Sirius Red staining. (G) Hepatic TG contents. (H) Quantitative analysis of DHE staining. (I) Serum ALT and AST levels. (J) The mRNA expression of Col1a1, Acta2, Il1b, Il6 and Tnf in the liver. (K-L) Cleaved caspase-3 expression of total liver lysates. (M) The liver MDA levels. (N) The liver GSH levels. (O) The mRNA expression of Fasn, Acaca, Scd1, Cpt1a, Acadm and Cd36. (H, J, L, O) WT/GFP group was set as 1. The data are expressed as the mean ± SD, n = 8, * P < 0.05 wt/GFP versus Adropin-KO/GFP; #P < 0.05 Adropin-KO/GFP versus Adropin-KO/Nrf2.

References

    1. Tiniakos D.G., Vos M.B., Brunt E.M. Nonalcoholic fatty liver disease: pathology and pathogenesis. Annu. Rev. Pathol. 2010;5:145–171. - PubMed
    1. Farrell G.C., Larter C.Z. Nonalcoholic fatty liver disease: from steatosis to cirrhosis. Hepatology. 2006;43:S99–S112. - PubMed
    1. Brunt E.M. Pathology of nonalcoholic fatty liver disease. Nat. Rev. Gastroenterol. Hepatol. 2010;7:195–203. - PubMed
    1. Neuschwander-Tetri B.A. Hepatic lipotoxicity and the pathogenesis of nonalcoholic steatohepatitis: the central role of nontriglyceride fatty acid metabolites. Hepatology. 2010;52:774–788. - PubMed
    1. Malhi H., Gores G.J. Molecular mechanisms of lipotoxicity in nonalcoholic fatty liver disease. Semin. Liver Dis. 2008;28:360–369. - PMC - PubMed

Publication types

MeSH terms