

Probe Sensitivity to Cortical versus Intracellular Cytoskeletal Network Stiffness
- PMID: 30685055
- PMCID: PMC6369565
- DOI: 10.1016/j.bpj.2018.12.021
Probe Sensitivity to Cortical versus Intracellular Cytoskeletal Network Stiffness
Abstract
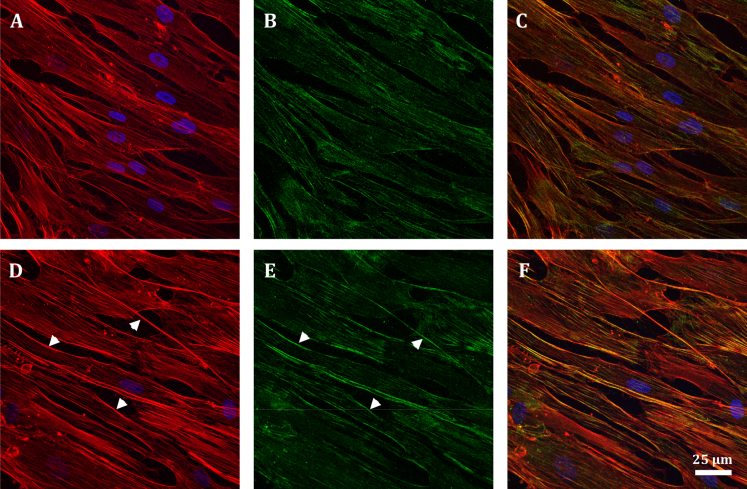
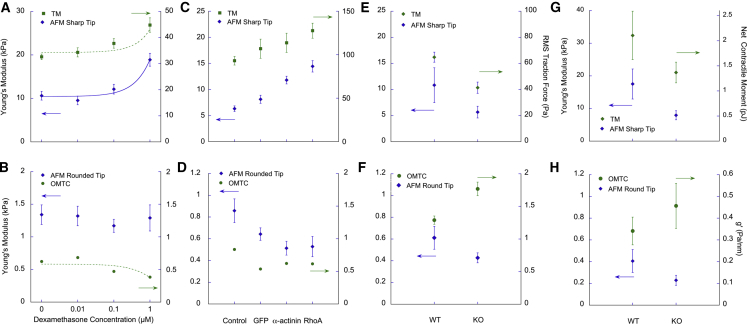
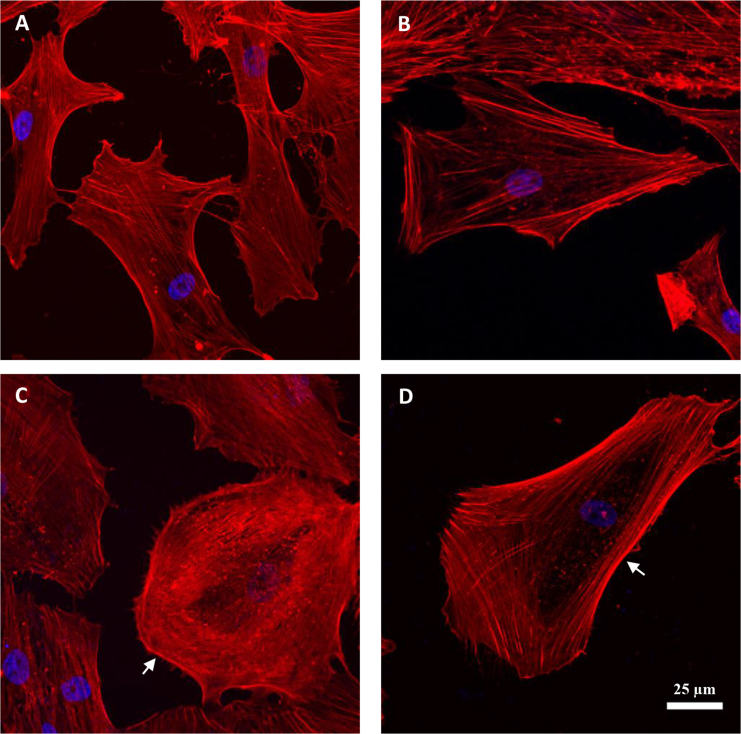
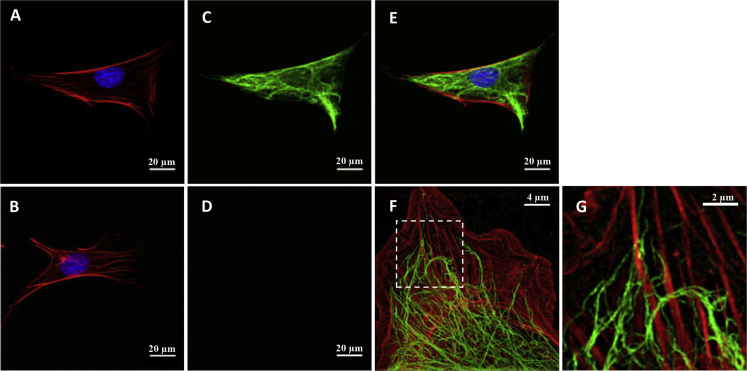
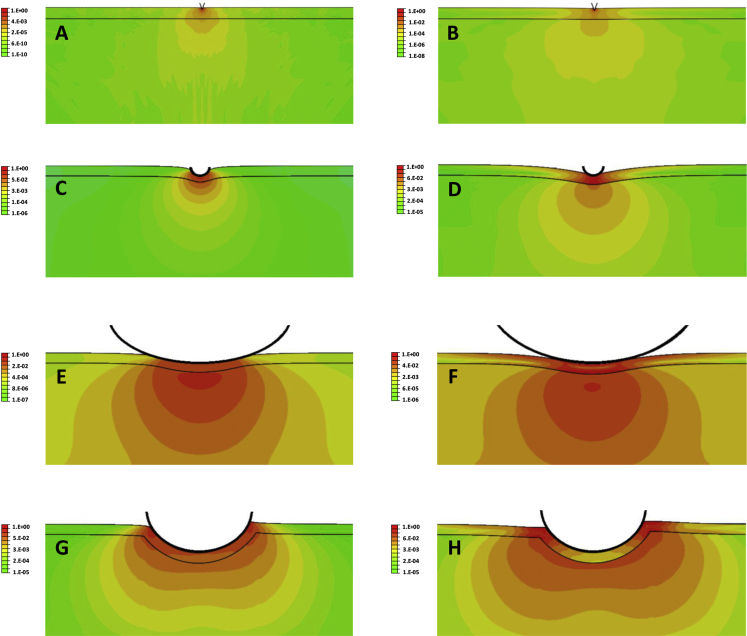
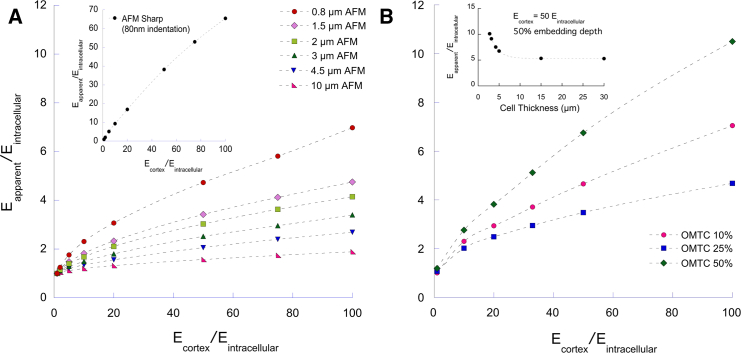
In development, wound healing, and pathology, cell biomechanical properties are increasingly recognized as being of central importance. To measure these properties, experimental probes of various types have been developed, but how each probe reflects the properties of heterogeneous cell regions has remained obscure. To better understand differences attributable to the probe technology, as well as to define the relative sensitivity of each probe to different cellular structures, here we took a comprehensive approach. We studied two cell types-Schlemm's canal endothelial cells and mouse embryonic fibroblasts (MEFs)-using four different probe technologies: 1) atomic force microscopy (AFM) with sharp tip, 2) AFM with round tip, 3) optical magnetic twisting cytometry (OMTC), and 4) traction microscopy (TM). Perturbation of Schlemm's canal cells with dexamethasone treatment, α-actinin overexpression, or RhoA overexpression caused increases in traction reported by TM and stiffness reported by sharp-tip AFM as compared to corresponding controls. By contrast, under these same experimental conditions, stiffness reported by round-tip AFM and by OMTC indicated little change. Knockout (KO) of vimentin in MEFs caused a diminution of traction reported by TM, as well as stiffness reported by sharp-tip and round-tip AFM. However, stiffness reported by OMTC in vimentin-KO MEFs was greater than in wild type. Finite-element analysis demonstrated that this paradoxical OMTC result in vimentin-KO MEFs could be attributed to reduced cell thickness. Our results also suggest that vimentin contributes not only to intracellular network stiffness but also cortex stiffness. Taken together, this evidence suggests that AFM sharp tip and TM emphasize properties of the actin-rich shell of the cell, whereas round-tip AFM and OMTC emphasize those of the noncortical intracellular network.
Copyright © 2019 Biophysical Society. Published by Elsevier Inc. All rights reserved.
Figures

Similar articles
-
The Mechanical Contribution of Vimentin to Cellular Stress Generation.J Biomech Eng. 2018 Jun 1;140(6). doi: 10.1115/1.4039308. J Biomech Eng. 2018. PMID: 29450503
-
Vimentin intermediate filaments modulate cell traction force but not cell sensitivity to substrate stiffness.Cytoskeleton (Hoboken). 2021 Jun;78(6):293-302. doi: 10.1002/cm.21675. Epub 2021 May 24. Cytoskeleton (Hoboken). 2021. PMID: 33993652
-
Loss of Vimentin Enhances Cell Motility through Small Confining Spaces.Small. 2019 Dec;15(50):e1903180. doi: 10.1002/smll.201903180. Epub 2019 Nov 13. Small. 2019. PMID: 31721440 Free PMC article.
-
Trabecular meshwork stiffness in glaucoma.Exp Eye Res. 2017 May;158:3-12. doi: 10.1016/j.exer.2016.07.011. Epub 2016 Jul 19. Exp Eye Res. 2017. PMID: 27448987 Free PMC article. Review.
-
Atomic force microscopy of virus shells.Semin Cell Dev Biol. 2018 Jan;73:199-208. doi: 10.1016/j.semcdb.2017.08.039. Epub 2017 Aug 26. Semin Cell Dev Biol. 2018. PMID: 28851598 Review.
Cited by
-
How does plasticity of migration help tumor cells to avoid treatment: Cytoskeletal regulators and potential markers.Front Pharmacol. 2022 Oct 6;13:962652. doi: 10.3389/fphar.2022.962652. eCollection 2022. Front Pharmacol. 2022. PMID: 36278174 Free PMC article. Review.
-
Increased stiffness and flow resistance of the inner wall of Schlemm's canal in glaucomatous human eyes.Proc Natl Acad Sci U S A. 2019 Dec 26;116(52):26555-26563. doi: 10.1073/pnas.1911837116. Epub 2019 Dec 5. Proc Natl Acad Sci U S A. 2019. PMID: 31806762 Free PMC article.
-
Nuclear lamin isoforms differentially contribute to LINC complex-dependent nucleocytoskeletal coupling and whole-cell mechanics.Proc Natl Acad Sci U S A. 2022 Apr 26;119(17):e2121816119. doi: 10.1073/pnas.2121816119. Epub 2022 Apr 19. Proc Natl Acad Sci U S A. 2022. PMID: 35439057 Free PMC article.
-
Glucocorticoid-Induced Ocular Hypertension and Glaucoma.Clin Ophthalmol. 2024 Feb 16;18:481-505. doi: 10.2147/OPTH.S442749. eCollection 2024. Clin Ophthalmol. 2024. PMID: 38379915 Free PMC article. Review.
-
Enhanced cell viscosity: A new phenotype associated with lamin A/C alterations.iScience. 2023 Aug 25;26(10):107714. doi: 10.1016/j.isci.2023.107714. eCollection 2023 Oct 20. iScience. 2023. PMID: 37701573 Free PMC article.
References
Publication types
MeSH terms
Substances
Grants and funding
LinkOut - more resources
Full Text Sources
Research Materials
Miscellaneous
