. 2019 Feb 5;116(3):530-539.
doi: 10.1016/j.bpj.2018.12.017. Epub 2019 Jan 3.

Size Matters: Ryanodine Receptor Cluster Size Heterogeneity Potentiates Calcium Waves

Affiliations

Size Matters: Ryanodine Receptor Cluster Size Heterogeneity Potentiates Calcium Waves

Yuanfang Xie et al. Biophys J. .

Abstract

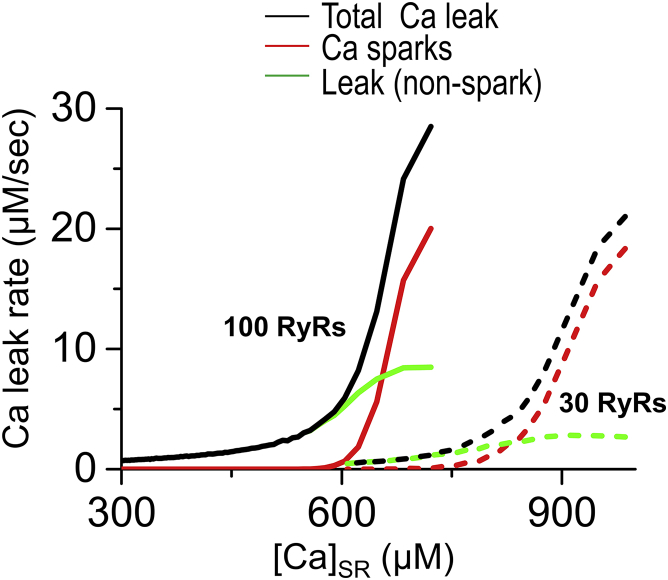
Ryanodine receptors (RyRs) mediate calcium (Ca)-induced Ca release and intracellular Ca homeostasis. In a cardiac myocyte, RyRs group into clusters of variable size from a few to several hundred RyRs, creating a spatially nonuniform intracellular distribution. It is unclear how heterogeneity of RyR cluster size alters spontaneous sarcoplasmic reticulum (SR) Ca releases (Ca sparks) and arrhythmogenic Ca waves. Here, we tested the impact of heterogeneous RyR cluster size on the initiation of Ca waves. Experimentally, we measured RyR cluster sizes at Ca spark sites in rat ventricular myocytes and further tested functional impacts using a physiologically detailed computational model with spatial and stochastic intracellular Ca dynamics. We found that the spark frequency and amplitude increase nonlinearly with the size of RyR clusters. Larger RyR clusters have lower SR Ca release threshold for local Ca spark initiation and exhibit steeper SR Ca release versus SR Ca load relationship. However, larger RyR clusters tend to lower SR Ca load because of the higher Ca leak rate. Conversely, smaller clusters have a higher threshold and a lower leak, which tends to increase SR Ca load. At the myocyte level, homogeneously large or small RyR clusters limit Ca waves (because of low load for large clusters but low excitability for small clusters). Mixtures of large and small RyR clusters potentiates Ca waves because the enhanced SR Ca load driven by smaller clusters enables Ca wave initiation and propagation from larger RyR clusters. Our study suggests that a spatially heterogeneous distribution of RyR cluster size under pathological conditions may potentiate Ca waves and thus afterdepolarizations and triggered arrhythmias.


Figures

Figure 1
Figure 1
Theoretical prediction of RyR cluster size effects on the Ca spark and nonspark event probability. (A) The dependence of the probability for m channels (m = 1 ∼ 6 is shown) simultaneous opening on RyR cluster size in the secondary opening (PCO = 0.003, according to the black circle in Fig. S2 C). (B) The accumulated probability of zero and one channel opening from the data in (A). (C) The accumulated probability of more than one channel simultaneous opening from the data in (A). The dependence of nonspark event probability (D) and Ca spark probability (E) on RyR cluster size is shown. Black and red is calculated when the secondary RyR opening probability PCO is equal to 0.003 and 0.01, respectively, corresponding to the black and red circle in Fig. S2 C. To see this figure in color, go online.
Figure 2
Figure 2
Ca flux rates and RyR cluster size. In large RyR clusters (100 RyRs, solid lines), the probability for the simultaneous openings of multiple RyRs increases, leading to larger spark rate and steeper release function than small clusters (30 RyRs, dashed lines) at a given [Ca]SR. Similarly, the nonspark leak rate is larger in large RyR clusters than small ones because of the higher probability of openings of only one or two RyRs. Black, red, and green indicate the total Ca release, Ca sparks release, and nonspark leak, respectively. To see this figure in color, go online.
Figure 3
Figure 3
Dependence of spark and nonspark leak on RyR cluster size in simulations. (A) Nonspark leak rate linearly increases with RyR cluster size but tends to decrease at large RyR cluster and high [Ca]SR (red). (B) Spark frequency steeply increases with RyR cluster size, showing a steeper release function in higher [Ca]SR (red versus black). Both spark amplitude (C) and duration (D) increases with RyR cluster size as more RyRs are recruited during a spark. (E) Total Ca leak rate increases steeply with RyR cluster size. Red and black indicate the average cell [Ca]SR fixed at 660 and 580 mM, respectively. The error bars show the SD over # simulations/clusters. To see this figure in color, go online.
Figure 4
Figure 4
Line scans showing sparks occur more frequently at large RyR cluster sites. (A) The longitudinal direction of the myocyte model is taken for line scan. Red circles indicate the large RyR cluster sites, and the others are the small ones. More frequent and larger sparks occur at large RyR cluster sites. (a) Small Ca spark and (b) quark nonspark leak at small cluster sites and (c) large Ca spark at large cluster site. More detailed spatial and temporal profiles are shown in Fig. S4. (B) Line scan shows similar phenomena in experiment. Left is an FKBP12.6 image of a myocyte, which shows the longitudinal direction for line scan (white line); in the middle, the line scan shows different Ca spark release (green) at different RyR cluster size (indicated by the intensity of red lines). The area inside the white frame was zoomed in to show the difference of RyR cluster size and Ca spark release (right panel). Small and large Ca sparks were shown on the top; the associated number indicates their incidences. To see this figure in color, go online.
Figure 5
Figure 5
Cluster size affects [Ca]Cleft. (A) The time average of both [Ca]Cleft and [Ca]Bulk increases as the cluster size becomes larger. [Ca]Cleft increases much more steeply with RyR cluster than [Ca]Bulk, and this difference between the time average of [Ca]Cleft and [Ca]Bulk becomes larger at higher [Ca]SR ([Ca]SR = 600 vs. 700 μM). Solid lines represent [Ca]SR = 700 μM. Dashed lines represent [Ca]SR = 600 μM. Black represents [Ca]Bulk. Red represents [Ca]Cleft. (B). NCX location affects the dependence of [Ca]Cleft on RyR cluster size. As the percentage of NCX in the cleft space increases, the increase of [Ca]Cleft (by comparing to [Ca]Bulk) with RyR cluster becomes smaller. Black represents 0% NCX in the cleft space and 100% NCX in the submembrane space. Red represents 11% NCX in the cleft space and 89% NCX in the submembrane space. This is a physiological distribution. Green represents 100% NCX in the cleft space and 0% NCX in the submembrane space. (C) The time-averaged [Ca]Cleft distribution. When a spontaneous Ca spark occurs, large [Ca]Cleft can be observed. ((D) shows a snapshot [Ca]Cleft distribution when a spontaneous Ca spark occurs). To see this figure in color, go online.
Figure 6
Figure 6
Ca waves occur in a myocyte model with heterogeneous RyR cluster size. (A) Because more sparks and nonspark leaks occur in large RyR clusters, [Ca]SR decreases as the cluster size increases. Blue, red, and green circles, respectively, indicate homogeneous cells with small, large, or medium (which is the average between large and small, as shown in D) RyR clusters. (B) In a myocyte with homogeneous distribution of large RyR clusters, [Ca]SR is too low to initiate waves (red circle), whereas in a myocyte with homogeneous distribution of small ones, sparks are too small to initiate waves (blue circle). A mixture of large and small clusters increases [Ca]SR enough for large RyR clusters to initiate waves (light green circle). This is not because of the difference in total number of RyRs in the cell but the heterogeneity in RyR clusters. A homogeneous distribution of RyR clusters with the same total RyRs also fails to initiate Ca waves (green circle). Red, green, and blue circles are corresponding to those in (A). (C) The corresponding two-dimensional distribution of underlying RyR clusters that potentiates Ca waves; red indicates large clusters, and blue indicates small ones. (D) Ca waves initiate from large RyR cluster sites and propagate into the whole cell. The time of the Ca snapshots is indicated to the right. (E) Probability of full waves. We simulated 20 times for each case with different random numbers. No full waves were observed when the size distribution is homogeneous. On the other hand, full waves were always observed when small and large clusters were mixed. To see this figure in color, go online.

References

    1. Bers D.M. Calcium cycling and signaling in cardiac myocytes. Annu. Rev. Physiol. 2008;70:23–49. - PubMed
    1. Pogwizd S.M., Bers D.M. Calcium cycling in heart failure: the arrhythmia connection. J. Cardiovasc. Electrophysiol. 2002;13:88–91. - PubMed
    1. Wehrens X.H., Lehnart S.E., Marks A.R. Intracellular calcium release and cardiac disease. Annu. Rev. Physiol. 2005;67:69–98. - PubMed
    1. Sato D., Bers D.M. How does stochastic ryanodine receptor-mediated Ca leak fail to initiate a Ca spark? Biophys. J. 2011;101:2370–2379. - PMC - PubMed
    1. Xie W., Brochet D.X., Cheng H. Deciphering ryanodine receptor array operation in cardiac myocytes. J. Gen. Physiol. 2010;136:129–133. - PMC - PubMed

Publication types

Substances