. 2019 Feb 11;48(3):313-328.e8.
doi: 10.1016/j.devcel.2018.12.018. Epub 2019 Jan 24.

Adaptive F-Actin Polymerization and Localized ATP Production Drive Basement Membrane Invasion in the Absence of MMPs

Affiliations

Adaptive F-Actin Polymerization and Localized ATP Production Drive Basement Membrane Invasion in the Absence of MMPs

Laura C Kelley et al. Dev Cell. .

Abstract

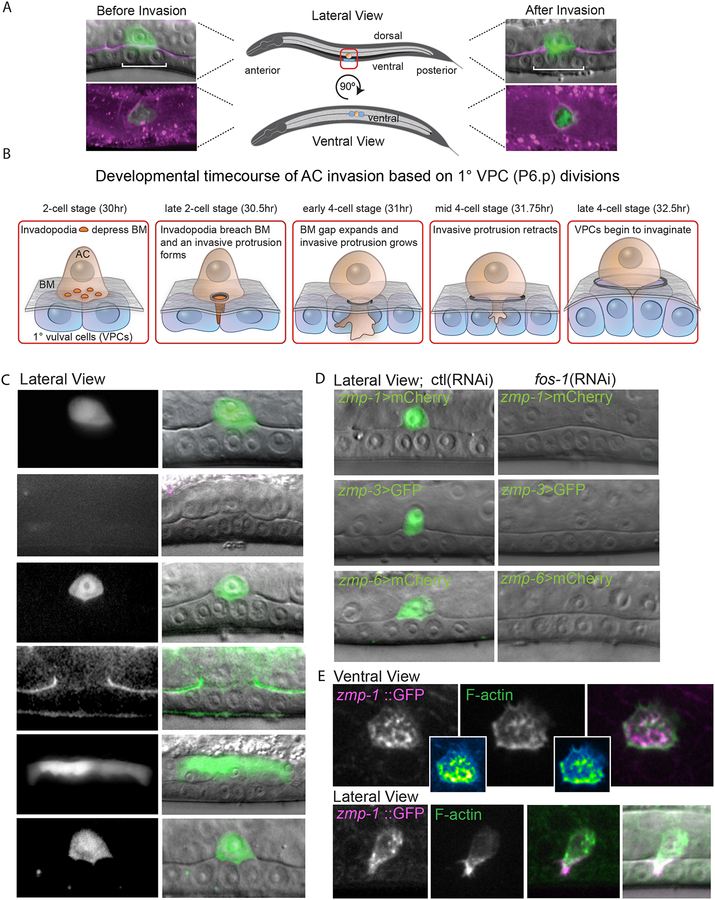
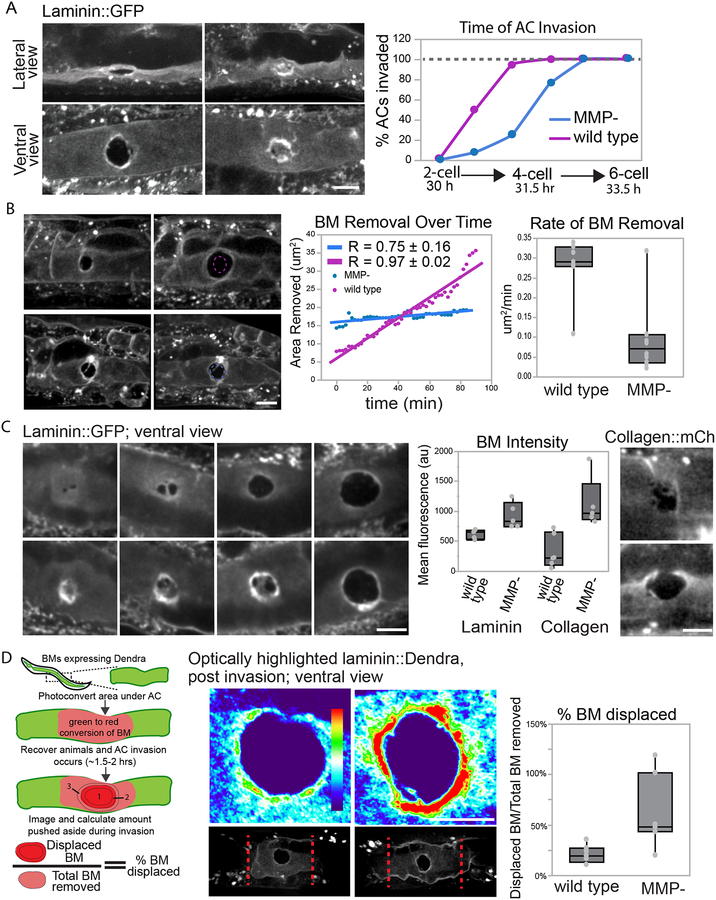
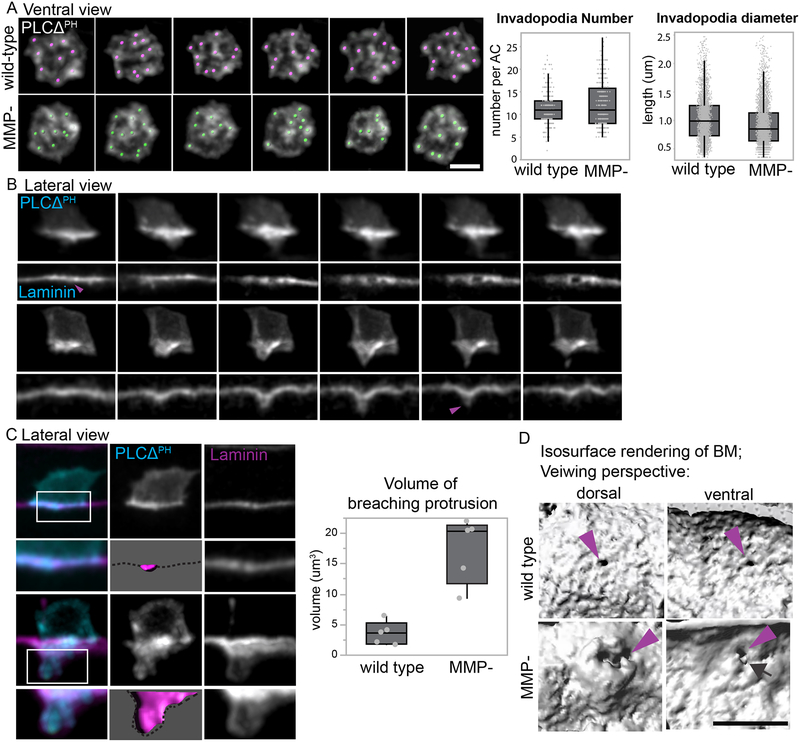
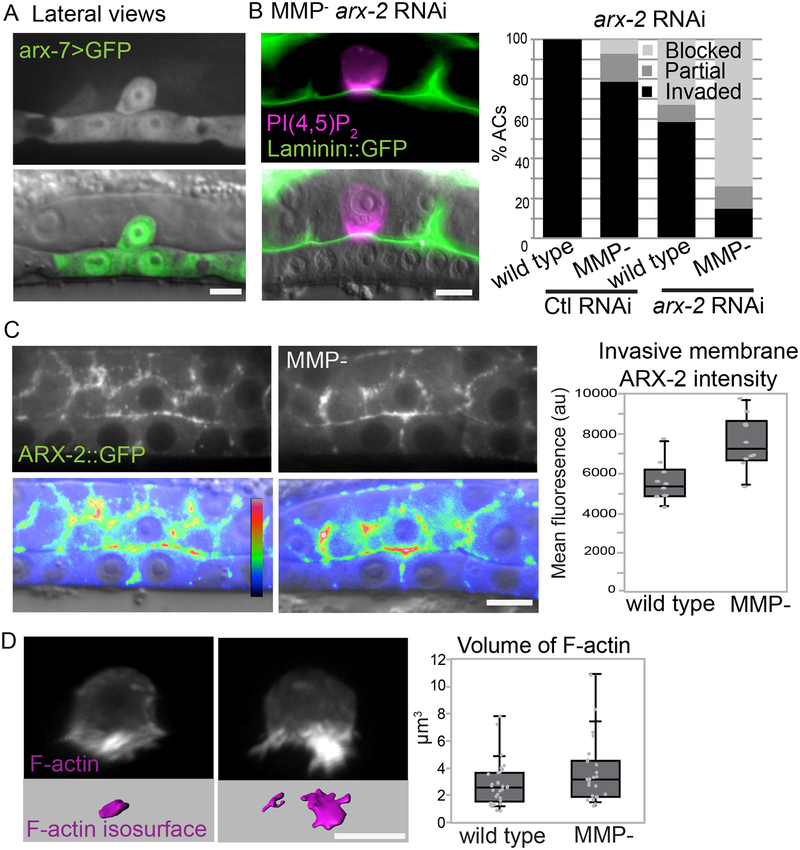
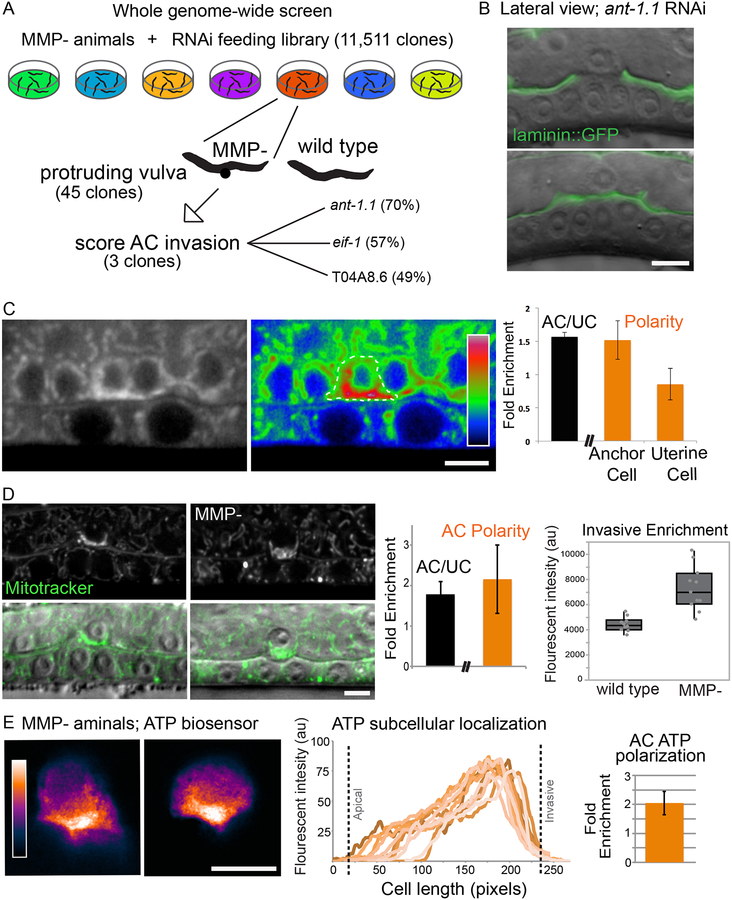
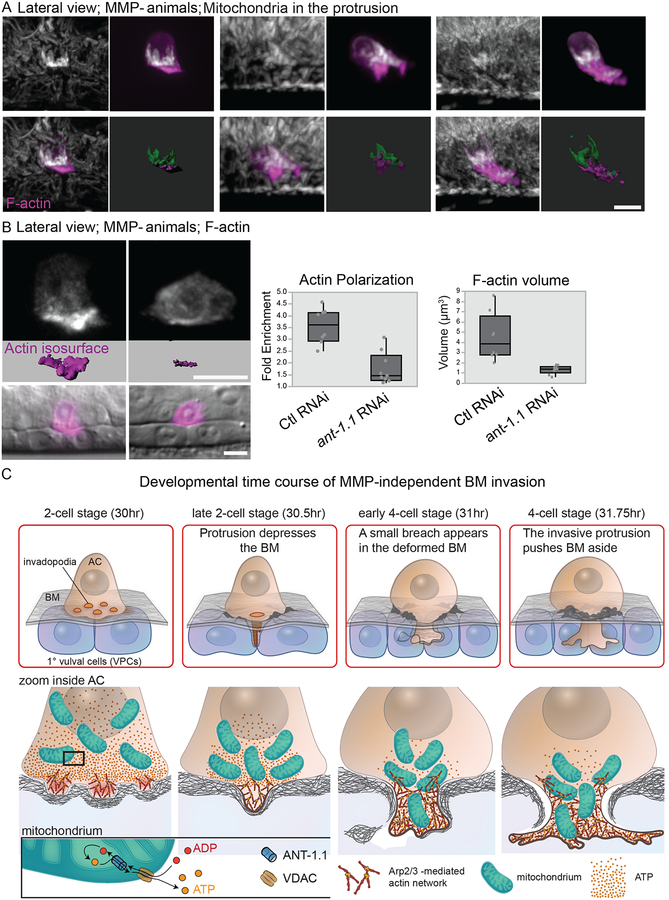
Matrix metalloproteinases (MMPs) are associated with decreased patient prognosis but have failed as anti-invasive drug targets despite promoting cancer cell invasion. Through time-lapse imaging, optical highlighting, and combined genetic removal of the five MMPs expressed during anchor cell (AC) invasion in C. elegans, we find that MMPs hasten invasion by degrading basement membrane (BM). Though irregular and delayed, AC invasion persists in MMP- animals via adaptive enrichment of the Arp2/3 complex at the invasive cell membrane, which drives formation of an F-actin-rich protrusion that physically breaches and displaces BM. Using a large-scale RNAi synergistic screen and a genetically encoded ATP FRET sensor, we discover that mitochondria enrich within the protrusion and provide localized ATP that fuels F-actin network growth. Thus, without MMPs, an invasive cell can alter its BM-breaching tactics, suggesting that targeting adaptive mechanisms will be necessary to mitigate BM invasion in human pathologies.

Keywords: ATP transport; actin dynamics; basement membrane; invasion; live imaging; matrix metalloproteinase; mitochondria.


Conflict of interest statement

DECLARATIONS OF INTEREST

The authors declare no competing interests.

Figures

Figure 1.
Figure 1.. MMPs are located within and around the AC during BM invasion.
(A) The AC (cdft-3>mCherry::moeABD; green) before and after invasion through BM (laminin::GFP, magenta). (B) Timeline for AC invasion after hatching at 20°C is shown. During the P6.p 2-cell stage of the 1°vulval precursor ce lls (1°VPCs, blue), the AC (orange) breaches the BM (grey) with invadodia that transform into an invasive protrusion. At the P6.p 4-cell stage, the invasive protrusion grows and expands the BM opening before retracting. (C) Reporters for zmp expression (left) show that zmp-1, −3, and −6 are expressed in the AC (right, overlay in green on DIC image) during invasion. ZMP-4 protein localizes to the BM (arrows) and the zmp-5 gene is expressed in the dorsal uterine cells above the AC. Zmp-2 is not detectable at the invasion site (see Figure S1C). (D) Expression of zmp-1, −3, and −6 in the AC (left, fluorescence overlay on DIC) decreased after fos-1 RNAi-mediated knockdown (right). Normalized reduction in zmp mean fluorescence levels are shown in white (mean ± SD, p ≤ 0.001, n ≥ 10 for each treatment). (E) CRISPR-Cas9-mediated zmp-1 translational GFP knock-in (left panels, green in merged image) and invadopodia (middle top, marked with F-actin marker mCherry::moeABD, arrows) and the invasive protrusion (middle bottom, arrows). Overlay reveals colocalization with invadopodia and protrusion (right). Pearson’s correlation coefficient (r) values on merged images are representative of 10 animals examined. Scale bars, 5μm.
Figure 2.
Figure 2.. MMP loss delays BM breaching time and decreases ECM removal.
(A) Wild-type (left) and MMP- animals expressing laminin::GFP were scored for precise BM breaching time. Confocal imaging (ventral and lateral views of the same animal) at the early P6.p 4-cell stage show MMP- worm delayed in BM breaching. Arrows point to the BM breach (black area). The graph shows the percentage of AC invasion at each developmental time point (N ≥ 200 animals for each group, Table S1). Time after hatching at 20°C is shown. (B) 90 minute time-lapse of wild-type (top) and MMP- (bottom) animals shows BM removal after breaching is delayed in MMP- worms. Circular dotted lines show region of BM clearance at t=0. The graph shows quantification of the BM removal over time. Box plots show the average rates of BM clearing in wild-type animals (0.28 ± 0.08 μm2/min) and in MMP-mutants (0.09 ± 0.09 μm2/min, mean ± SD, p ≤ 0.01, Student’s t-test, n= 7 animals for wild-type: n=10 for MMP). (C) Confocal sum projections of laminin::GFP (left panels) and collagen::mCh (right images) during AC invasion in wild type animals (upper) and in MMP- (lower) mutants show the progression of BM clearance by the AC. The fluorescence intensity of the BM at the perimeter of the cleared area (arrows) is increased in the absence of MMPs (~1.8 for laminin (1116 ± 352 vs 620 ± 75) and ~3.4 fold for collagen (1123 ± 426 vs 329 ± 279, mean ± SD, p≤0.01, Student’s t-test, wild-type, n=5 and 6; MMP-, n=9 and 5 for laminin::GFP and collagen::mCh, respectively)). (D) Schematic showing photoconversion of BM under the AC (green to red) before invasion. The amount of red BM physically displaced by the AC was calculated with post invasion images using regions 1–3 (see Methods). Grayscale (bottom, converted region is between red dotted lines) and spectral representation (top) of fluorescence intensity of optically converted laminin::Dendra show increased BM displacement in MMP- (right) animals (21 ± 0.09% in wild- type worms (left) versus 62 ± 35% in MMP- mutants, p≤0.05, mean ± SD, Student’s t-test, n=7 each group). Scale bars, 5μm.
Figure 3.
Figure 3.. Large protrusions breach the BM in the absence of MMPs.
(A) Ventral view 3D time series of dynamic invadopodia enriched with PtdIns(4,5)P2 (cdh-3>mCherry::PLCΔPH) in MMP- (bottom row) and wild-type (top row) animals at the early P6.p 2-cell stage. Colored spots are overlaid on invadopodia as identified and tracked by Imaris 3D software. No differences were detected in invadopodia number (left boxplot; 12.00 ± 4.82, n = 420 in MMP- versus 11.40 ± 3.46, mean ± SD, n = 298 wild type, p=0.06) or invadopodia diameter (right boxplot; 0.93 ± 0.37, N= 4608 MMP- versus 1.03 ± 0.39, N= 3429 wild-type, p<.0001, Student’s t-test). (B) Time series of the invasive protrusion (arrows, visualized with mCherry::PLCΔPH) that clears BM (purple arrowhead indicates BM breaching time) in wild type animals and initiates the BM breach in MMP- mutants. (C) At the time of BM breaching, an invadopodium (arrow; imaged with mCherry::PLCΔPH) occupies the BM gap (arrowhead; visualized with laminin::GFP) in wild type animals (upper panels). A large protrusion is associated with the BM breach in MMP- animals (lower panels). Isosurface renderings (magenta, dotted line represents the BM) were used to measure the volume of the AC’s protrusion that breached the BM and data from pooled animals is shown in the boxplot (17.3 ± μm3 MMP- versus 3.6 ± 1.9 μm3 wild-type, mean ± SD, p<0.01, Student’s t-test, N=5 each group). (D) Dorsal and ventral isosurface renderings (grayscale) of the BM breach in wild-type (top panels) and MMP- animals (bottom panels). Purple arrowheads point to the BM breach sites, and the cyan arrow points to a BM tear in the MMP- animal. Scale bars, 5μm.
Figure 4.
Figure 4.. An increase in Arp2/3 and F-actin support MMP-independent invasion.
(A) The Arp2/3 subunit arx-7 (arx-7>GFP) is expressed in the AC (arrow) during invasion. (B) Loss of MMPs sensitize animals to RNAi-mediated knockdown of the arx-7 (see Table S1) or arx-2 subunits. The percent of animals that display blocked, partial or normal invasion in wild type and MMP- animals is shown in the graph. (C) Wild type (left) and MMP- (right) ARX-2::GFP knock-in animals are shown in grayscale (top) and DIC overlayed by spectral imaging (bottom). The mean fluorescence of ARX-2::GFP at the invasive membrane (arrowheads) of the AC (arrow) is increased in MMP- animals (right boxplots; 7586 ± 1332 versus 5607 ± 991; mean ± SD, N= 10, each genotype; p<.01). (D) Representative 3D images of AC specific expression of F-actin (mCherry::moeABD) in grayscale (top). Isosurface rendering of F-actin intensity (magenta) in wild type versus MMP- animals. Graph shows quantification (1.58 ± 0.19 μm3 wild type vs 6.77 ± 3.54 μm3 MMP-, mean ± SD, p<.0001, Student’s t-test, n=15 each group). Scale bars, 5μm.
Figure 5.
Figure 5.. MMP- synergistic screen identifies a mitochondrial ADP/ATP translocase.
(A) RNAi clones targeting 11,511 genes were fed to newly hatched MMP- L1 animals. Adult worms with a Protruding vulval (Pvl) phenotype were scored for AC invasion defects if the gene did not cause Pvls in wild-type worms. (B) Representative images of AC (arrow) invasion in animals treated with ant-1.1 RNAi shows the blocked invasion in MMP- animals (arrowheads). (C) Grayscale (left) and spectral (right) imaging showing ANT-1.1 (ant-1.1>ANT-1.1::GFP) levels enriched in the AC (1.6 ± 0.06; n= 10; dotted outline). Within the AC, ANT-1.1 is enriched (1.5 ± 0.2; n=5; arrowhead) to the invasive membrane compared to neighboring uterine cells ((0.85 ± 0.2; n=5; mean ± SD, p=0.02) marked by asterisks, see Methods). (D) MitoTracker staining (top, and merged with DIC on bottom) shows a similar enrichment pattern to ANT-1.1 in the AC (arrow) compared to neighboring cells (AC/UC 1.8 ± 0.3, n=10; left bar graph and AC polarity 2.2 ± 0.9; n=11). Fluorescence intensity of MitoTracker Red is higher at the invasive membrane (arrowheads) in MMP- animals (boxplots MMP= 7297 ± 1751, N=11; wild type=4436 ± 180, mean ± SD, N=10, p0.0001). (E) Representative images of sensitized emission (FRET/CFP ratios) spectra of the ATP biosensor in the AC (cdh-3>ATeam). ATP levels in the AC are highest at the invasive cell membrane (arrows) in MMP- animals (line graph of mean gray value plotted for 8 animals along the apical to basal (invasive) axis of the AC; bar graph = 2.5 ± 0.04, n=8). Scale bars, 5μm.
Figure 6.
Figure 6.. Mitochondria are tightly juxtaposed to the invasive F-actin networks.
(A) Mitochondria initially are juxtaposed to F-actin the invasive membrane before occupying the invasive protrusion alongside the F-actin network. Mitochondria staining is shown alone (DIOC6(3)); white, or merged with F-actin (mCherry::moeABD; magenta). Masked images and isosurface labeling of F-actin (magenta) and mitochondria (green) during early (left images), mid (center images) and late (right images) stages of AC invasion. (B) Actin enrichment decreased from 3.6 to 1.7 fold (p=0.0001) and the volume of the F-actin decreased by 70% (4.48 ± 2.34 to 1.31 ± 0.04 μm3; mean ± SD, p=0.006, n=8 each group) after treatment with ant-1.1 RNAi in MMP- animals. (C) Schematic diagram showing the time course of adaptive MMP- invasion. Invasion is delayed and is propelled by increased Arp2/3-mediated F-actin networks and enrichment of mitochondria/ATP (via ANT-1.1 ADP/ATP translocase), which helps form a large protrusion that breaches and displaces BM through physical forces. VDAC is an outer mitochondrial membrane pore that facilitates diffusion of small hydrophilic molecules such as ATP & ADP. Scale bars, 5 μm.

Comment in

References

    1. Altieri DC (2017). Mitochondria on the move: emerging paradigms of organelle trafficking in tumour plasticity and metastasis. Br J Cancer 117, 301–305. - PMC - PubMed
    1. Altincicek B, Fischer M, Fischer M, Lüersen K, Boll M, Wenzel U, and Vilcinskas A (2010). Role of matrix metalloproteinase ZMP-2 in pathogen resistance and development in Caenorhabditis elegans. Dev Comp Immunol 34, 1160–1169. - PubMed
    1. Arismendi-Morillo G, Hoa NT, Ge L, and Jadus MR (2012). Mitochondrial network in glioma’s invadopodia displays an activated state both in situ and in vitro: potential functional implications. Ultrastruct Pathol 36, 409–414. - PubMed
    1. Bieling P, Li T-D, Weichsel J, McGorty R, Jreij P, Huang B, Fletcher DA, and Mullins RD (2016). Force Feedback Controls Motor Activity and Mechanical Properties of Self-Assembling Branched Actin Networks. Cell 164, 115–127. - PMC - PubMed
    1. Boone C, Bussey H, and Andrews BJ (2007). Exploring genetic interactions and networks with yeast. Nat Rev Genet 8, 437–449. - PubMed

Publication types

MeSH terms