. 2019 Feb 7;176(4):897-912.e20.
doi: 10.1016/j.cell.2018.12.036. Epub 2019 Jan 24.

The cis-Regulatory Atlas of the Mouse Immune System

Affiliations

The cis-Regulatory Atlas of the Mouse Immune System

Hideyuki Yoshida et al. Cell. .

Abstract

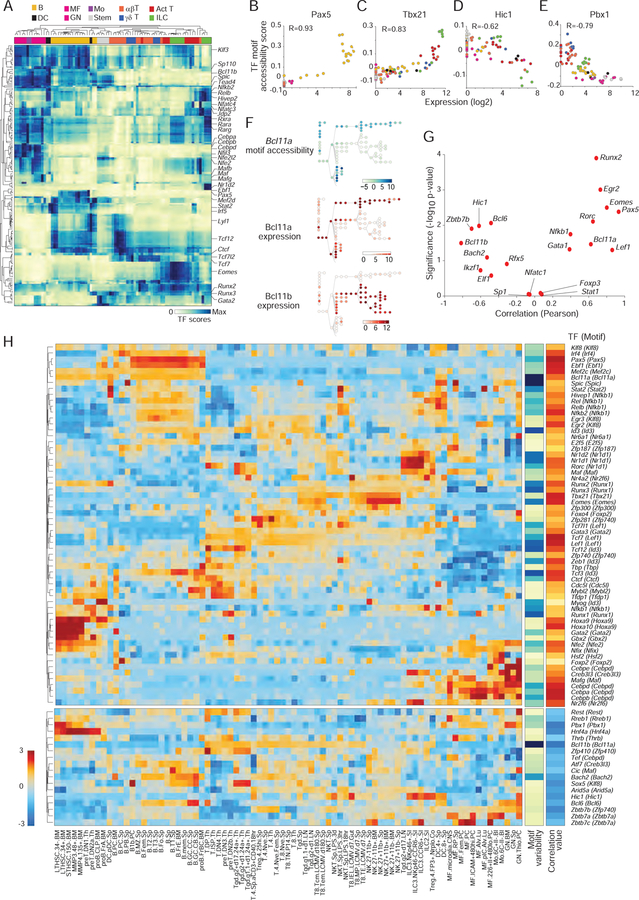
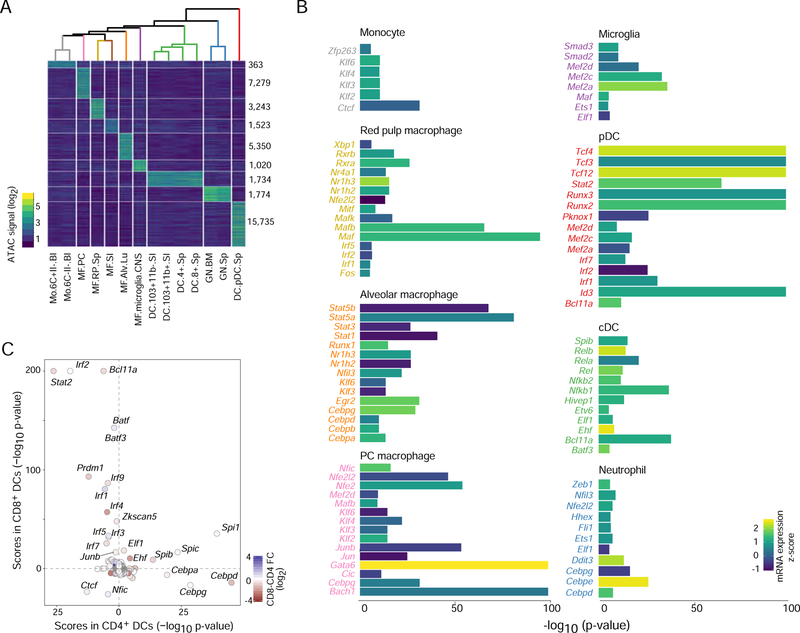
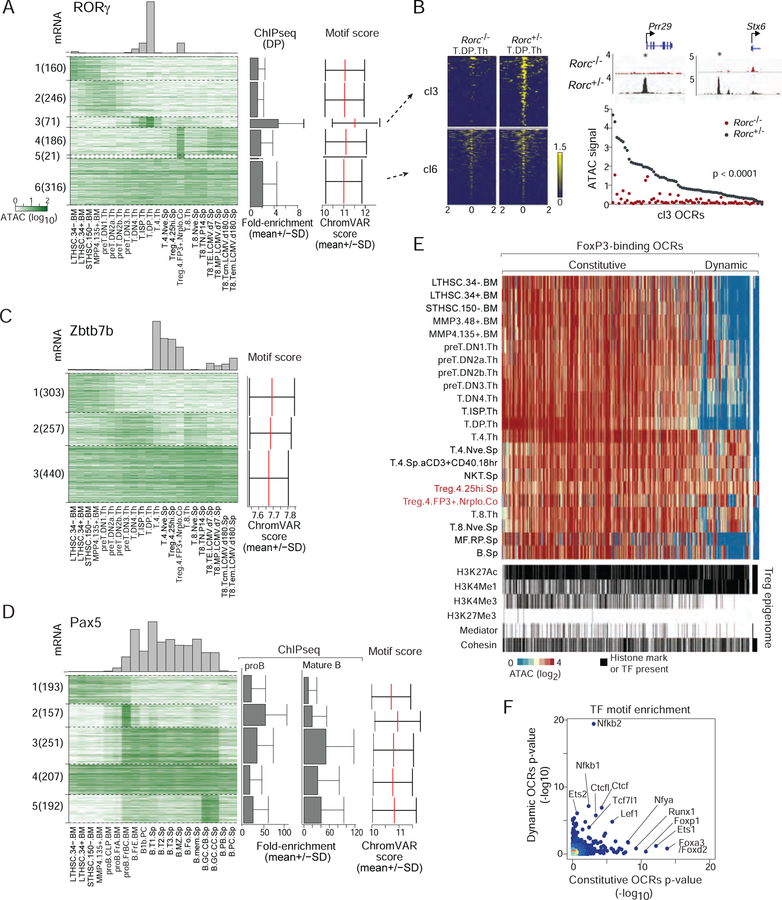
A complete chart of cis-regulatory elements and their dynamic activity is necessary to understand the transcriptional basis of differentiation and function of an organ system. We generated matched epigenome and transcriptome measurements in 86 primary cell types that span the mouse immune system and its differentiation cascades. This breadth of data enable variance components analysis that suggests that genes fall into two distinct classes, controlled by either enhancer- or promoter-driven logic, and multiple regression that connects genes to the enhancers that regulate them. Relating transcription factor (TF) expression to the genome-wide accessibility of their binding motifs classifies them as predominantly openers or closers of local chromatin accessibility, pinpointing specific cis-regulatory elements where binding of given TFs is likely functionally relevant, validated by chromatin immunoprecipitation sequencing (ChIP-seq). Overall, this cis-regulatory atlas provides a trove of information on transcriptional regulation through immune differentiation and a foundational scaffold to define key regulatory events throughout the immunological genome.

Keywords: ATAC-seq; Transcriptional regulation; chromatin; enhancer; epigenomics; immune cell differentiation; transcription factor.


Figures

Figure 1.
Figure 1.. Overview for the chromatin and RNA profiling of broad immune cell populations.
(A) Cell-types in this study shown in a differentiation tree, color-coded by lineage. Stromal cells, and myeloid cell-types known to derive from embryonic precursors, are shown unconnected to the HSC-derived tree. (B) Representative pile-up traces of ATAC-seq signals, all to the same scale, for three genomic regions: Spi1 (encodes PU.1); Cd8, with previously determined enhancer elements shown (E8I to E8VI, top, red arrows denote novel OCRs in cDCs); the Hprt promoter as a housekeeping gene. mRNA levels are indicated by barplots at the right of each locus; *: no matching RNA-seq data. (C) A t-SNE representation of all OCRs identified in this study. Top panel: the Gini index characterizes OCRs that are broadly accessible (blue) or cell-type specific (red); middle: OCRs specifically open in progenitors or dendritic cells; bottom: OCRs at TSS or that contain CTCF motifs. See Fig. S1.
Figure 2.
Figure 2.. Integrated ATAC-RNA variance decomposition: parsing enhancer influence.
(A) Matrices of Pearson correlation between cell-types, based on ATAC signal intensity at all TSS-OCR, all DE OCRs, or mRNA levels in RNA-seq. Color-coding of cell-types at right per Fig. 1A. (B) Variance component decomposition of the mRNA expression for every gene (as column), in a variance component model that discretizes the explanatory power of DE- or TSS-OCRs (blue and green, respectively), the proportion of unexplained variance being shown in red. (C) Enrichment in TF-binding sequence motifs (signed -log10 p, Fisher test) in the promoter-proximal region (−1000 to +1 bp) of genes with DE-logic and TSS-logic determinism (from 2B). See Fig. S2.
Figure 3.
Figure 3.. Landscape of cis-regulation: associating genes with specific enhancers.
(A) Example of correlated mRNA expression (x-axis) and OCR accessibility (y-axis) at the Samd3 locus. (B) As in A, but correlation between expression and activity of a strongly associated DE-OCR for 1000 genes. (C) Distance distribution of DE-OCRs that are strongly correlated (Bonferroni p<0.05) to a given gene, relative to the gene’s TSS. (D) Number of significantly associated DE-OCRs for each gene. (E) Chromatin accessible landscape of the Il7r locus for all cell-types (histogram of expression at right). Red arcs correspond to 21 OCRs that share significant correlation with Il7r expression; non Il7r associations are shown in black (height reflects association p-value). (F) ATAC-seq signal in the promoter and enhancer regions of Rag1 and Rag2 loci in B and T precursors (right: mRNA expression). Previously reported DNAse-I hypersensitivity sites are indicated below. *: newly identified OCRs. (G, H) Identification by multiple regression of OCRs that complementarily explain the expression patterns of Tyrobp and Cd28; heatmaps denote accessibility at these OCRs; the bar histogram mRNA expression. See Fig. S3.
Figure 4.
Figure 4.. Timing of OCR activation.
(A) Heatmap representing expression of 496 genes that vary most through T cell differentiation (ordered by k-means, color-coded relative to the 95th expression quantile). (B) Integrated accessibility of variable DE-OCR in the −10 kb>−250 bp region of these genes (order as in A). C: Timing of enhancer activation: for genes which are induced during T differentiation, the dots denote the cell-stage at which mRNA expression first reaches 50% of max (x-axis) vs the stage at which the best correlated OCR (from Fig. 3) first reaches 50% of max accessibility. See Fig. S4.
Figure 5.
Figure 5.. Regulators of chromatin accessibility.
(A) Transcription factor motif accessibility scores, TFs in rows (z-normalized), cell-types in columns (hierarchically clustered). (B–E) Relationship between the expression of a TF and its motif accessibility score for representative factors; each point represents a cell-type, color-coded per Fig. 1A. (F) Accessibility score of Bcl11a motifs (top; cells arranged per Fig. 1A) in relation to the expression of Bcl11a or Bcl11b (bottom). (G) Pearson coefficient and significance of correlations between TF motif score and TF expression (generalized from B–E); known regulators of immune cell development and function are highlighted in red. (H) Expression patterns of the TFs determined to significantly correlate with changes in chromatin accessibility (positive correlation: top block; negative: bottom). Side bars: motif variability and correlation coefficient. See Fig. S5.
Figure 6.
Figure 6.. Regulatory factors in myeloid cells inferred from chromatin accessibility.
(A) Differential OCR signals across all steady-state myeloid cells (right: numbers of distinguishing OCRs; top: correlation tree). (B) TF motif enrichment scores (chromVAR z-test) in myeloid group-specific OCRs from A, filtered for TF expression levels and statistical significance, with signed -log10 p values capped at 100 for display; bars shaded by TF mRNA expression. (C) Comparison of TF enrichment scores for OCRs accessible CD4+ and CD8+ cDCs, points are shaded according to the TF’s mRNA expression fold change between the two DC subsets. See Fig. S6.
Figure 7.
Figure 7.. Dynamics of chromatin accessibilities on TF-motif containing OCRs along differentiation.
(A–D) Cell-type-dependent accessibility for OCRs that contain RORγ, Zbtb7b or Pax5 motifs (top 1000 predicted OCRs, clustered by k-means; top: mRNA levels; right: TF motif scores and ChIP-seq signals averaged per cluster). (B) Normalized ATAC-seq intensity for OCRs that contain an RORγ-binding motif of cluster3 or cluster6 (from A), in immature DP thymocytes of Rorc-deficient mice or -positive littermates. (E) Chromatin accessibility for 1080 DE-OCRs known to bind FoxP3 in ChIP-seq experiments. Distal OCRs are classified as constitutive or dynamic (2-fold higher signal in Tregs than in precursor cell-types). ChIP-seq signal in these OCRs for Mediator, Cohesin, or histone marks in Tregs are shown below. (E) TF motif enrichment score in constitutive and dynamic FoxP3-binding OCRs. See Fig. S7.

Similar articles

Cited by

References

    1. Anscombe FJ (1948). The Transformation of Poisson, Binomial and Negative-Binomial Data. Biometrika 35, 246–254.
    1. Asai T, and Morrison SL (2013). The SRC family tyrosine kinase HCK and the ETS family transcription factors SPIB and EHF regulate transcytosis across a human follicle-associated epithelium model. J. Biol. Chem 288, 10395–10405. - PMC - PubMed
    1. Bahr C, von Paleske L, Uslu VV, Remeseiro S, Takayama N, Ng SW, Murison A, Langenfeld K, Petretich M, Scognamiglio R, et al. (2018). A Myc enhancer cluster regulates normal and leukaemic haematopoietic stem cell hierarchies. Nature 553, 515–520. - PubMed
    1. Banerji J, Rusconi S, and Schaffner W (1981). Expression of a beta-globin gene is enhanced by remote SV40 DNA sequences. Cell 27, 299–308. - PubMed
    1. Benoist C, and Chambon P (1981). In vivo sequence requirements of the SV40 early promotor region. Nature 290, 304–310. - PubMed

Publication types

MeSH terms