. 2019 Feb 7;176(4):913-927.e18.
doi: 10.1016/j.cell.2018.11.042. Epub 2019 Jan 24.

A Platform for Generation of Chamber-Specific Cardiac Tissues and Disease Modeling

Affiliations

A Platform for Generation of Chamber-Specific Cardiac Tissues and Disease Modeling

Yimu Zhao et al. Cell. .

Abstract

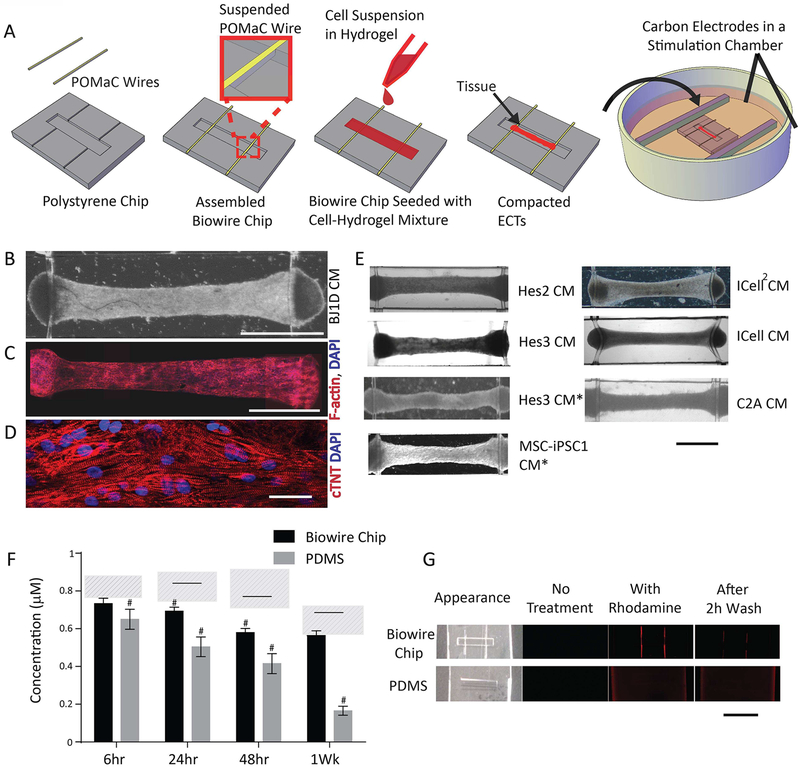
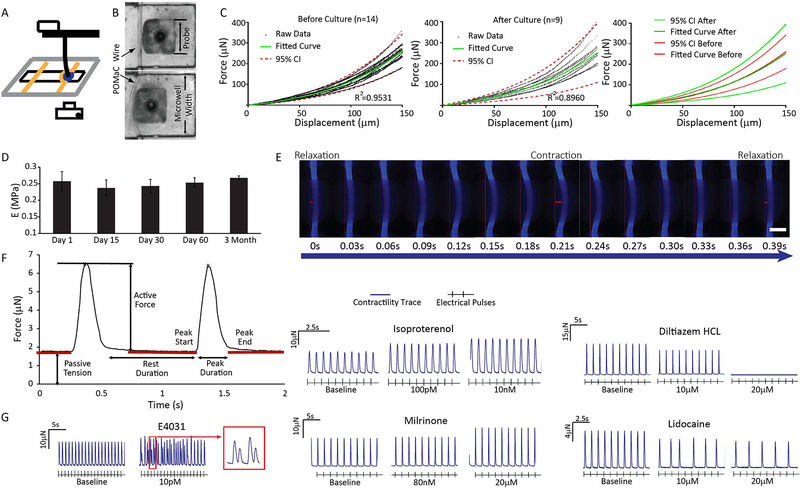
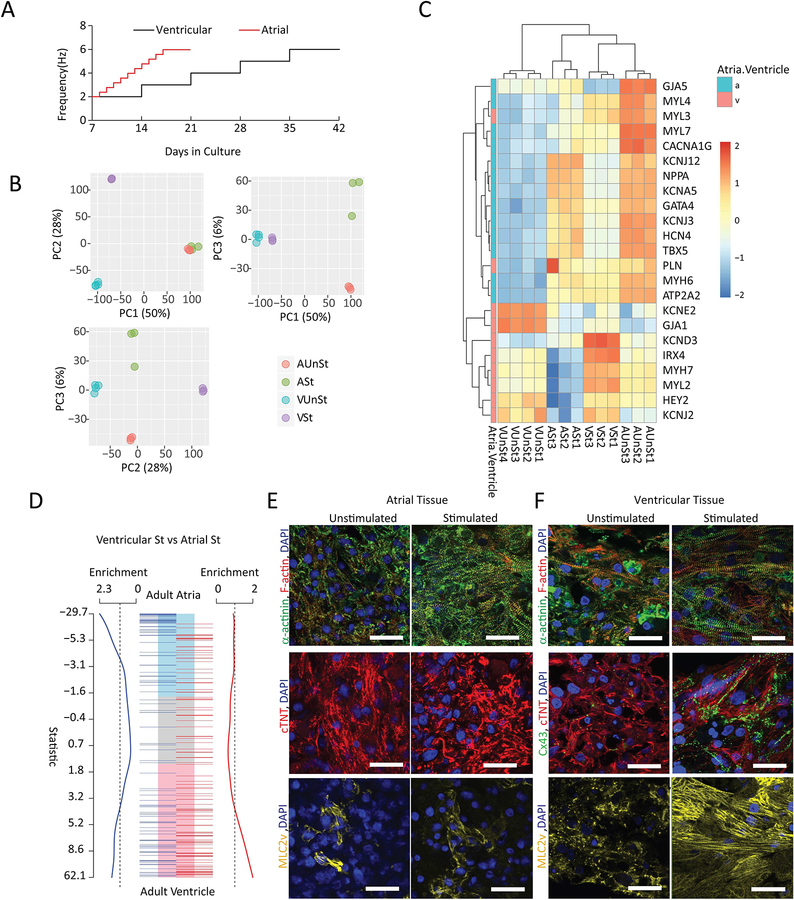
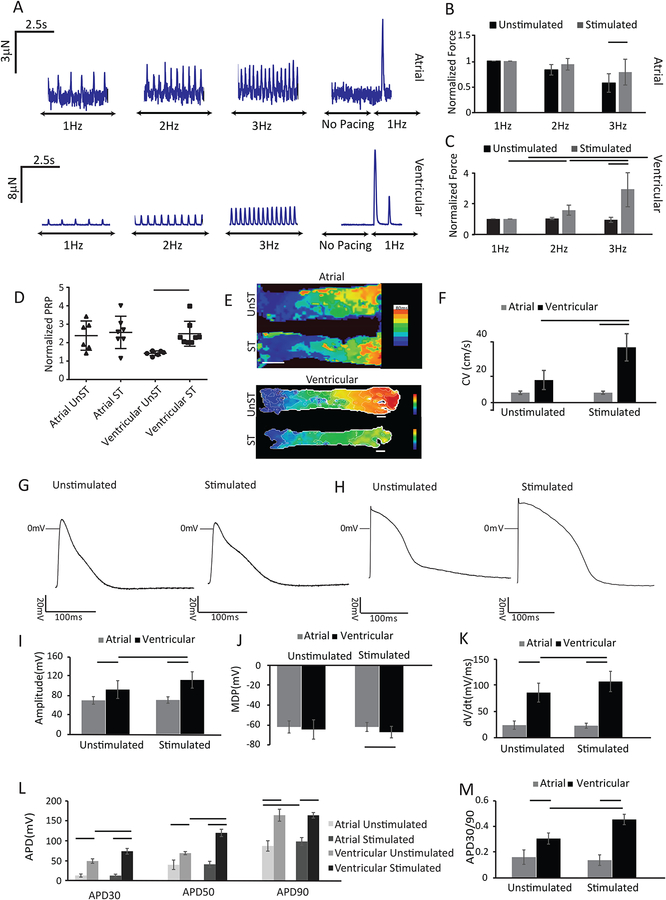
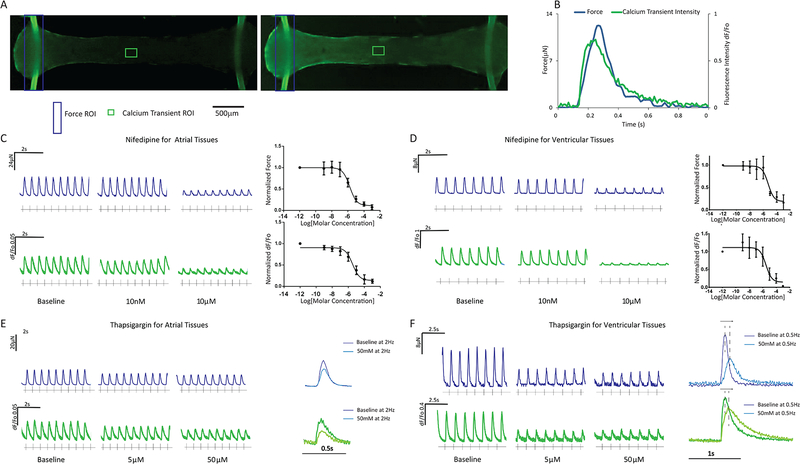
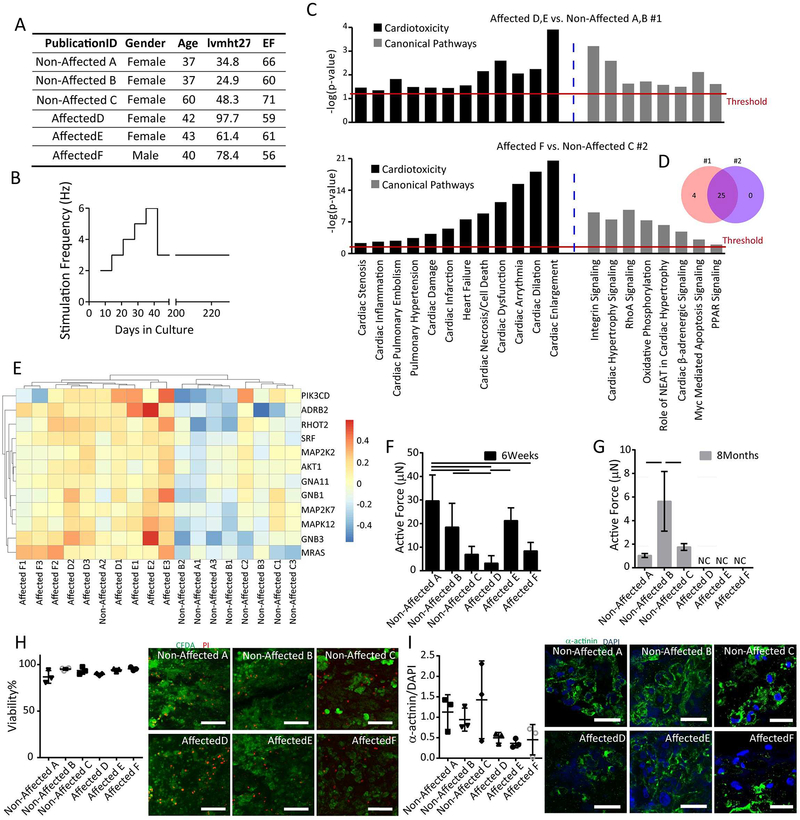
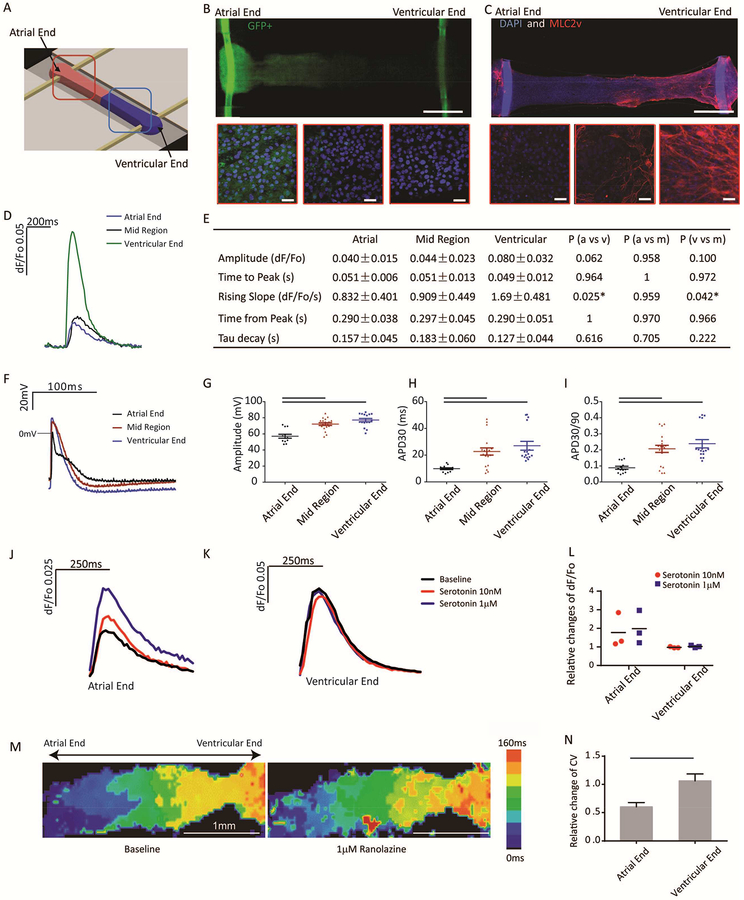
Tissue engineering using cardiomyocytes derived from human pluripotent stem cells holds a promise to revolutionize drug discovery, but only if limitations related to cardiac chamber specification and platform versatility can be overcome. We describe here a scalable tissue-cultivation platform that is cell source agnostic and enables drug testing under electrical pacing. The plastic platform enabled on-line noninvasive recording of passive tension, active force, contractile dynamics, and Ca2+ transients, as well as endpoint assessments of action potentials and conduction velocity. By combining directed cell differentiation with electrical field conditioning, we engineered electrophysiologically distinct atrial and ventricular tissues with chamber-specific drug responses and gene expression. We report, for the first time, engineering of heteropolar cardiac tissues containing distinct atrial and ventricular ends, and we demonstrate their spatially confined responses to serotonin and ranolazine. Uniquely, electrical conditioning for up to 8 months enabled modeling of polygenic left ventricular hypertrophy starting from patient cells.

Keywords: Cardiomyocyte; action potential; atrial; calcium transient; contractility; drug testing; electrophysiology; heart; polygenic cardiac disease; tissue engineering; ventricular.


Conflict of interest statement

Declaration of Interests:

YZ, BZ, KRB, GV-N and MR are co-founders and shareholders of TARA Biosystems Inc; NF, RAS are employees and shareholders of the company; MR and GVN are also on the Board of Directors and receive compensation for this role. YZ, BZ and MR are inventors of a patent application related to this work (Pub.No.: US20160282338A1). GK is a scientific cofounder, advisor and equity holder of BlueRock Therapeutics. All other authors have no conflicts of interest.

Figures

Figure 1:
Figure 1:. The Biowire II platform for micro-scale engineered cardiac tissues.
A) Schematic. Representative tissues in Biowire II platform: B) bright field image (Scale bar=1mm); composite confocal images of C) F-actin and DAPI staining (Scale bar=1mm) and D) troponin-T and DAPI staining (Scale bar=30μm). E) Representative bright field images of tissues from several CM sources; *denotes atrial-specific tissues. (Scale bar=1mm). F) Rhodamine B absorption after incubation in Biowire II or PDMS chips for 6h, 24h, 48h and 1week. # indicates p<0.05 vs. control at each time point. Solid line indicates significant difference between the two groups. Dashed areas represent levels of rhodamine B in control polystyrene tissue culture wells. (Data shown as avg±stdev, n=3, Two-way ANOVA plus Tukey’s test). G) Bright field and fluorescence images of chips without rhodamine B incubation (No Treatment), incubated with rhodamine B for 1wk (With Rhodamine) and incubated with Rhodamine B for 1wk followed by washout for 2h (After 2h Wash). Scale bar=5mm. See also Figure S1 and Movie S1.
Figure 2:
Figure 2:. Biowire II platform enables non-invasive assessment of passive tension and active force.
A) Schematic of apparatus for calibrating POMaC wires using a displacement test. B) POMaC wire configuration prior to contact and after displacement by a 0.5mm probe. C) No differences in mechanical properties of the POMaC wires were detected before and 6 weeks after cell cultivation. D) The Young’s Modulus of POMaC wires was comparable during 3 months of culture with cells and media (avg±stdev, n≥3, one-way ANOVA). E) Time lapse images showing POMaC wire bending by tissue contraction, paced at 1Hz. Scale bar=200μm. Wire bending due to passive tension and active force are illustrated by the red bars. F) Typical forces traces of contracting tissues. G) Representative traces of changes in active force and beat patterns of tissues under stimulation in response to the application of compounds with well-known cardiac actions. Tissues were generated from ventricular Hes3 hESC-CM and BJ1D iPSC-CM. See also Figure S1 and Movie S2
Figure 3:
Figure 3:. Atrial and ventricular tissues exhibit distinct patterns of gene expression and morphology upon chronic electrical conditioning.
A) Electrical conditioning protocols. B) Principal component analyses indicate distinct clustering of atrial versus ventricular tissues with (St) and without (UnSt) electrical conditioning (n=3–4/group). C) Heat maps illustrating differences in expression levels of selected atrial and ventricular functional markers. D) Gene set enrichments based on custom cardiac ontologies for adult ventricle and atria. Electrically conditioned ventricular Biowires are significantly enriched for human ventricular genes, whereas conditioned atrial Biowires are enriched for human atrial genes. In A-D, all tissues were derived from HES3 cells. E) Confocal images of representative atrial and ventricular tissues immunostained for sarcomeric α-actinin and F-actin (first row); connexin-43 (Cx43, only for ventricular tissues) and cardiac troponin-T (second row) and Myosin light chain 2v (MLC2v) (third row). All samples were counterstained with DAPI. Atrial tissues were derived from HES3 hESC-CM and ventricular from BJ1D iPSC-CM. Scale bars=30μm. See also Figure S3, S4.
Figure 4:
Figure 4:. Atrial and ventricular tissues exhibit distinct functional responses after electrical conditioning.
A) Representative force traces of atrial and ventricular tissues. Summary of active forces normalized to the force at 1Hz for (B) atrial and (C) ventricular tissues with and without electrical conditioning (avg±stdev, n≥7 for atrial and n≥10 for ventricular Biowires, p<0.05 with two way ANOVA). D) Summary results for PRP normalized to the last pacing frequency (n≥6). E) Conduction velocity maps for atrial and ventricular tissues. Scale bars =500μm for atrial and 200μm for ventricular tissue. F) Summary of propagation velocity. (Avg±stdev, n≥4; two way ANOVA). Chamber-specific AP profiles of (G) atrial and (H) ventricular tissues. Summary data of : I) AP amplitudes, J) maximum diastolic potentials (MDP), K) upstroke velocities, L) AP duration measure at 30%, (APD30), 50% (APD50) and 90% (APD90) repolarization, M) APD30/APD90 ratios (APD30/90) (Avg±stdev, n≥3; two way ANOVA). Atrial tissues were created from HES3 hESC-CM and ventricular from BJ1D iPSC-CM. See also Figure S3–S7 and Movie S3, S4.
Figure 5:
Figure 5:. Simultaneous force and Ca2+ transient measurements and their responses to drugs in atrial and ventricular tissues.
A) Typical images of biowires loaded with a Ca2+ dye (Fluo-4) before (left) and after (right) field stimulation. B) Representative transients. Typical force (blue) and Ca2+ transients (green) in (C) atrial or (D) ventricular tissues following the treatment with Nifedipine and the associated dose response (avg±stdev, n=3) or treatment with Thapsigargin in (E) atrial or (F) ventricular tissues along with overlays of forces and Ca2+ transients before (baseline) and after Thapsigargin addition. Atrial tissues were derived from HES3 hESC-CM and ventricular from BJ1D iPSC-CM. See also Movie S5 and S6.
Figure 6:
Figure 6:. Biowire II platform enables cardiac disease modelling.
A) Summary of clinical features, hypertrophy index (lvmht27) and ejection fraction (EF), of hypertensive patients contributing iPSCs. B) Long-term electrical conditioning protocol mimicking chronic increased workloads in ventricular tissues created from patient iPSC-CMs. C) Gene Set Enrichment Analysis (GSEAs) was performed in two independent experiments (Non-affected A, B vs. Affected D, E; Non-affected C vs. Affected F) revealing enrichment in the Affected groups for genes associated with cardiotoxicity and cardiac related canonical pathways (determined by IPA Tox List analysis). D) Venn diagram indicates overlap of enriched signaling pathways related to cardiotoxicity from the two experiments. The functional categories shown are ones with Benjamini-Hochberg multiple correction p≤0.05. E) Heat map showing a sub-set of genes related to cardiac hypertrophy. F) Active force was reduced in tissues derived from the patients exhibiting left ventricular hypertrophy in response to a prolonged hypertension (Affected D vs. Affected E, p=0.0387) compared to the Non-Affected groups (Non-affected A vs. Affected D, p=0.0006; Non-affected A vs. Affected F, p=0.0023; Non-affected B vs. Affected D, p=0.0382, One way ANOVA with Tukey’s test) after 6 weeks in culture. G) Active force was absent in all tissues from the Affected (Affected D, E and F) versus Non-Affected participants (Non-affected A, B, and C) after 8 months culture period. H) Live (green) and dead (red) staining of tissues at the end of 8 month culture period. Viability was quantified with no significant differences among the groups. Scale bar=100μm; I) Confocal images and quantification of the presence of sarcomeric α-actinin (green) counterstained with DAPI (Blue), Scale bar=30μm (One way ANOVA with Tukey’s test).
Figure 7:
Figure 7:. Engineering of atrioventricular tissues.
A) Schematics of the experimental set-up. B) Atrial (GFP+) and ventricular (GFP−) CMs are placed at the opposite ends of the Biowires suspended between two POMaC wires exhibiting green autofluorescence. Zoomed images from right-to-left are taken from the atrial end, the mid region (mixed atrial and ventricular) and the ventricular end. (Scale bar=0.5mm,) C) Only ventricular end of the tissues stains positive for myosin light chain 2v (MLC2v). Zoomed-in insets from the atrial end, mid region and ventricular end were compared. Nuclei are counterstained with DAPI. POMaC polymer wires exhibit blue autofluorescence (Scale bar = 0.5mm, Insets scale bar=30μm). F) Representative traces of Ca2+ transients from atrial, mid and ventricular region of atrioventricular tissues. E) Quantification of Ca2+ transients. AP F) profiles, G) amplitude H) APD30 and I) APD30/90 from atrial, mid and ventricular regions were compared. Representative traces of Ca2+ transients in response to serotonin at J) the atrial end and K) the ventricular end on the tissue. L) Change in Ca2+ transient amplitude in response to serotonin normalized to the baseline. (n=3, two way ANOVA with Sidak’s test); M) Optical mapping of impulse propagation before and after application of 1μM ranolazine. N) Quantification of the conduction velocity upon ranolazine application after normalization to the baseline (avg±stdev, n=4, p=0.0007, Student’s t test). In J-N, both ends of the tissue were derived from HES3 hESC. See also Movie S7.

Comment in

References

    1. Aggarwal P, Turner A, Matter A, Kattman SJ, Stoddard A, Lorier R, Swanson BJ, Arnett DK, and Broeckel U (2014). RNA expression profiling of human iPSC-derived cardiomyocytes in a cardiac hypertrophy model. PloS one 9, e108051. - PMC - PubMed
    1. Ahn S, Ardona HAM, Lind JU, Eweje F, Kim SL, Gonzalez GM, Liu Q, Zimmerman JF, Pyrgiotakis G, Zhang Z, et al. (2018). Mussel-inspired 3D fiber scaffolds for heart-on-a-chip toxicity studies of engineered nanomaterials. Analytical and bioanalytical chemistry. - PMC - PubMed
    1. Blatter LA (2017). The intricacies of atrial calcium cycling during excitation-contraction coupling. The Journal of general physiology 149, 857–865. - PMC - PubMed
    1. Bray NL, Pimentel H, Melsted P, and Pachter L (2016). Near-optimal probabilistic RNA-seq quantification. Nature biotechnology 34, 525–527. - PubMed
    1. Burashnikov A, and Antzelevitch C (2008). How Do Atrial-Selective Drugs Differ From Antiarrhythmic Drugs Currently Used in the Treatment of Atrial Fibrillation? Journal of atrial fibrillation 1, 98–107. - PMC - PubMed

Publication types

MeSH terms