. 2019 Mar 7;73(5):885-899.e6.
doi: 10.1016/j.molcel.2018.12.008. Epub 2019 Jan 24.

Genetic Screens Reveal FEN1 and APEX2 as BRCA2 Synthetic Lethal Targets

Affiliations

Genetic Screens Reveal FEN1 and APEX2 as BRCA2 Synthetic Lethal Targets

Kristen E Mengwasser et al. Mol Cell. .

Abstract

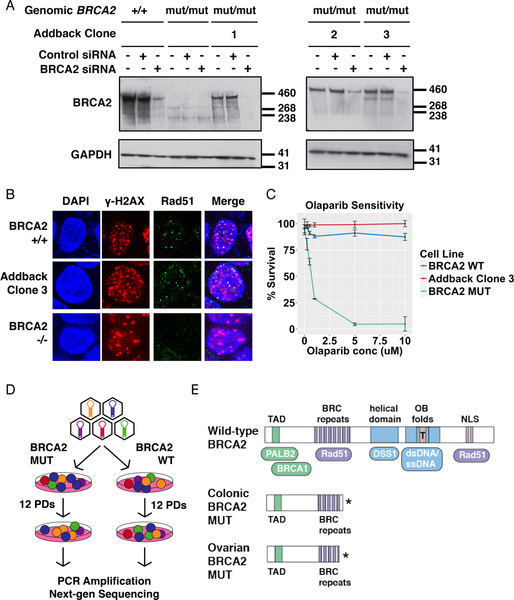
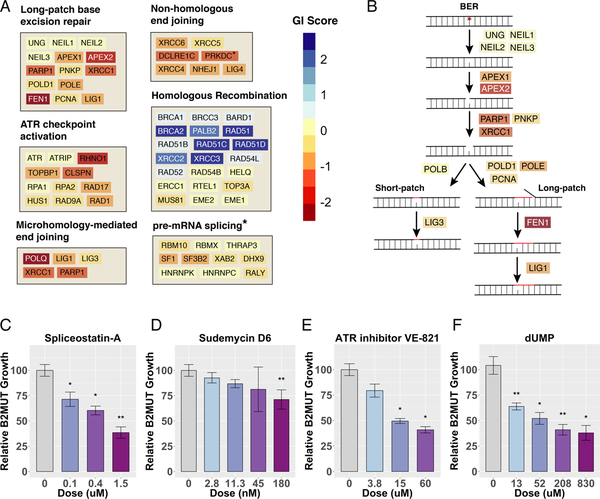
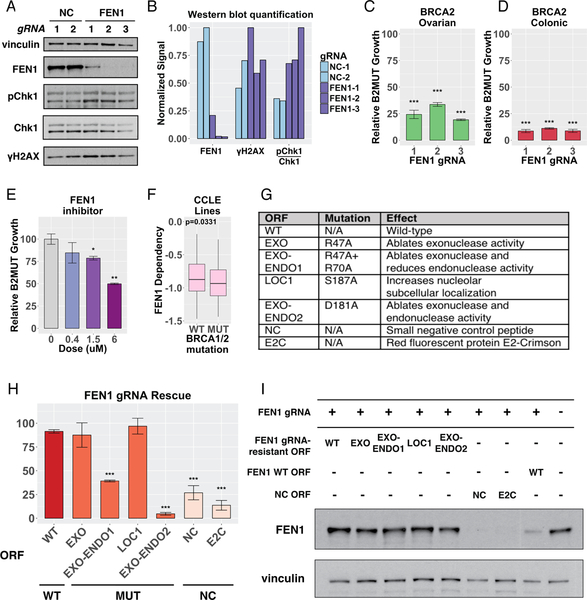
BRCA1 or BRCA2 inactivation drives breast and ovarian cancer but also creates vulnerability to poly(ADP-ribose) polymerase (PARP) inhibitors. To search for additional targets whose inhibition is synthetically lethal in BRCA2-deficient backgrounds, we screened two pairs of BRCA2 isogenic cell lines with DNA-repair-focused small hairpin RNA (shRNA) and CRISPR (clustered regularly interspaced short palindromic repeats)-based libraries. We found that BRCA2-deficient cells are selectively dependent on multiple pathways including base excision repair, ATR signaling, and splicing. We identified APEX2 and FEN1 as synthetic lethal genes with both BRCA1 and BRCA2 loss of function. BRCA2-deficient cells require the apurinic endonuclease activity and the PCNA-binding domain of Ape2 (APEX2), but not Ape1 (APEX1). Furthermore, BRCA2-deficient cells require the 5' flap endonuclease but not the 5'-3' exonuclease activity of Fen1, and chemically inhibiting Fen1 selectively targets BRCA-deficient cells. Finally, we developed a microhomology-mediated end-joining (MMEJ) reporter and showed that Fen1 participates in MMEJ, underscoring the importance of MMEJ as a collateral repair pathway in the context of homologous recombination (HR) deficiency.

Keywords: APEX2; ATR; BER; BRCA1; BRCA2; FEN1; MMEJ; NHEJ; PARP; synthetic lethality.


Conflict of interest statement

Declaration of Interests

The authors declare no competing interests.

Figures

Figure 1.
Figure 1.. Establishment of isogenic cell line systems for BRCA2 SL screening.
(A) Extracts from the indicated cell lines, untreated or treated with the indicated siRNAs, were immunoblotted with antibodies to BRCA2 and GAPDH. Left and right panels were run as separate gels. (B) Immunofluorescence was performed on cells of the indicated genotypes, with antibodies to γH2AX and Rad51 protein, to evaluate foci formation after 10 Gy IR. (C) The indicated cell lines were passaged in the presence of the indicated dose of olaparib or DMSO. After 3 d, cell survival was quantified using CellTiter-Blue. Error bars reflect the variability of biological triplicates. (D) Schematic diagram depicting the experimental procedure for BRCA2 SL screening in isogenic BRCA2 cell lines. (E) Schematic of wild-type BRCA2 structure, depicted with its functional domains and sites of interaction with key binding partners. Brca2 truncation mutant proteins possessed by the colonic and ovarian BRCA2 MUT cell lines used in this study are shown for comparison.
Figure 2.
Figure 2.. BRCA2 Synthetic Lethal Screen Results.
(A-C) Volcano plots for the shRNA colonic, CRISPR colonic, and CRISPR ovarian B2SL screens. Significance (-log10FDR) is plotted against the genetic interaction (GI) score (average log2 fold-change for each gene in BRCA2 MUT versus BRCA2 WT cells). Genes that met a significance threshold of -log10FDR>1 are color-coded as green for relative dropout or red for relative enrichment in BRCA2 MUT vs BRCA2 WT cells. (D-F) Results from the colonic shRNA, colonic CRISPR, and ovarian CRISPR B2SL screens, plotted as the log2 fold-change in BRCA2 MUT cells against the log2 fold-change in BRCA2 WT cells. (G-H) Comparison of GI score (average log2 fold-change for each gene in BRCA2 MUT versus BRCA2 WT cells) in the ovarian CRISPR screen versus the colonic CRISPR screen (G), and the ovarian CRISPR screen versus primary shRNA screen (H).
Figure 3.
Figure 3.. Pathway Analysis of BRCA2 Synthetic Lethality.
(A) Performance of genes in several key pathways, plotted on a color scale for genetic interaction (GI) score: the normalized average log2 fold-change across both colonic and ovarian CRISPR screens. The asterisk indicates reporting of GI score from the shRNA screen instead of combined CRISPR screens. (B) Schematic of the base excision repair (BER) pathway, showing the strength of the GI score for each gene in the pathway, plotted on the same color scale as in (A). (C-F) MCA assays in which colonic GFP-labeled BRCA2 MUT and E2-Crimson-labeled BRCA2 WT cells were mixed and co-treated with the indicated drugs. The change in percent GFP+ cells was measured by FACS after 12 d and normalized to vehicle control. Error bars reflect the variability of biological triplicates.
Figure 4.
Figure 4.. APEX2 is synthetic lethal with BRCA1 and BRCA2 deficiency.
(A-D) MCA assays were performed using the indicated gRNAs in the indicated cell backgrounds. GFP-labeled B2MUT cells were mixed with isogenic E2-Crimson-labeled B2WT cells, and the cell mixture was co-infected with the indicated individual gRNAs. After selection, the change in percent GFP+ cells was quantified by FACS before and after 7 d of culture, and normalized to negative control gRNAs. Error bars reflect the variability of biological triplicates, and the number of asterisks indicates the statistical significance for the corresponding experiment calculated by t-test (*=p<0.05,**=p<0.01,***=p<0.001). (E-F) MCA assays (as described above) in which colonic B2MUT and B2WT cells were mixed and treated for 12 d with the Ape nuclease inhibitor APEIII or the Ape1 redox inhibitor E3330. Error bars reflect the variability of biological triplicates, and asterisks indicated statistical significance as described above. (G) List of ORFs tested for complementation in cells expressing Cas9 and a gRNA to APEX2. (H) Examination of the ability of the ORFs from (F) to rescue the growth defect caused by expression of Cas9 and an APEX2 gRNA in ovarian B2MUT cells. Cells were co-infected with lentivirus expressing an APEX2 gRNA and the indicated gRNAresistant APEX2 ORF or negative control peptide. Growth was quantified after selection and growth for 8 d. (I) List of ORFs tested for complementation in cells expressing Cas9 and a gRNA to APEX2. (J) Examination of the ability of the ORFs from (I) to rescue the growth defect caused by expression of Cas9 and an APEX2 gRNA in ovarian B2MUT cells. Cells were co-infected with lentivirus expressing an APEX2 gRNA and the indicated gRNA-resistant APEX2 ORF or negative control peptide. Growth was quantified after selection and growth for 2 d.
Figure 5.
Figure 5.. FEN1 and APEX2 loss leads to DNA damage in BRCA2 mutant cells.
(A) Immunofluorescence was performed on ovarian B2MUT cells transfected with the indicated siRNAs, using an antibody to γH2AX, to evaluate foci formation. (B) Quantification of the number γH2AX foci formed in (G) in 30 representative cells transfected with siRNA to the indicated genes. (C) Examination of DDR signaling in extracts of WT and BRCA2 mutant cells transfected with the indicated siRNAs and immunoblotted with the indicated antibodies. (D) Quantitation of phospho-Chk1, phospho-H2AX and phospho-RPA32 from the BRCA2 mutant cell extracts in experiment (C).
Figure 6
Figure 6. FEN1 loss is synthetic lethal with BRCA1 and BRCA2 deficiency.
(A) Extracts from B2MUT ovarian cells expressing Cas9 and the indicated gRNAs were immunoblotted with the indicated antibodies. (B) Quantification of signal detected Western blotting in (A), normalized to vinculin. (C-D) MCA assays in which the indicated GFP-labeled B2MUT cells and E2-Crimson-labeled B2WT cells were mixed and co-infected with 3 individual gRNAs to FEN1. The cell mixture was cultured for 7 d, and the change in percent GFP+ cells was quantified by FACS and normalized to the average of the negative control Grna-expressing cells shown in Supplemental Figure 3A. Error bars reflect the variability of biological triplicates, and the number of asterisks indicates the statistical significance for the corresponding experiment (*=p<0.05,**=p<0.01,***=p<0.001). (E) MCA assay in which colonic GFP-labeled BRCA2 MUT cells and E2-Crimson-labeled BRCA2 WT cells were mixed and co-treated with the indicated doses of a FEN1 inhibitor. The cell mixture was cultured for 7 d, and the change in percent GFP+ cells was quantified by FACS and normalized to negative control gRNA-expressing cells. Error bars reflect the variability of biological triplicates, and asterisks indicate statistical significance as described above. (F) Dependency of BRCA1/2 MUT or BRCA1/2 WT cell lines on FEN1, determined from genome-scale CRISPR-Cas9 essentiality screens across 324 cancer cell lines from the Cancer Cell Line Encyclopedia (CCLE) (Meyers et al., 2017). (G) List of gRNA-resistant ORFs tested for complementation in BRCA2 MUT cells expressing Cas9 and a FEN1 gRNA. (H) Examination of the ability of the ORFs listed in (G) to rescue the growth defect caused by expression of Cas9 and a FEN1 gRNA. BRCA2 MUT ovarian cells were co-infected with lentivirus expressing a FEN1 gRNA and the indicated gRNA-resistant FEN1 ORF or negative control peptide. After selection and growth for 8 d, survival was quantified with a FACS-based cell counting method. (I) Extracts from BRCA2 WT cells expressing Cas9, a validated FEN1 gRNA, and the indicated gRNA-resistant ORF were immunoblotted with the indicated antibodies; all panels are derived from the same blot.
Figure 7.
Figure 7.. FEN1 participates in MMEJ.
(A) Schematic of MMEJ reporter. (B-D) Negative control siRNA-transfected cells from (E) were infected with lentivirus expressing I-SceI, grown for 5 d, and were FACS-sorted for E2-Crimson+GFP+ populations (C) or GFP+ populations (D). Genomic DNA was isolated from these FACS-sorted cell populations as well as total unsorted cells (B), and the E2-Crimson construct was PCR-amplified and adapted for Illumina sequencing. The results of 500K reads were plotted for each cell population as a percent of MMEJ or NHEJ, with the indicated size (bp) of microhomology utilized for repair. Restoration of the wild-type sequence is indicated with an asterisk. (E-F) U2-OS cells containing the MMEJ reporter were transfected with the indicated siRNAs and transduced with lentiviral I-SceI. The percent of E2-Crimson+GFP+ cells was quantified by FACS after 5 d of growth. Error bars reflect variability of technical triplicates, and the number of asterisks indicates the statistical significance for the corresponding siRNA versus negative control siRNA (*=p<0.05,**=p<0.01,***=p<0.001) (F). FACS plots for a representative replicate from each experiment are shown in (E). (G) U2-OS cells containing the MMEJ reporter were treated with the indicated drugs at increasing doses and transduced with lentiviral I-SceI (DNA-PK inhibitor doses: 1=3.5 μM, 2=8.5 μM, 3=12 μM, FEN1 inhibitor doses: 1=5 μM, 2=10 μM, 3=25 μM). The percent of E2-Crimson+GFP+ cells was quantified by FACS after 5 d of growth. Error bars reflect variability of technical quadruplicates, and the number of asterisks indicates the statistical significance for the corresponding siRNA versus vehicle control, as described above.

References

    1. Adamson B, Smogorzewska A, Sigoillot FD, King RW, and Elledge SJ (2012). A genome-wide homologous recombination screen identifies the RNA-binding protein RBMX as a component of the DNA-damage response. Nat Cell Biol 14, 318–328. - PMC - PubMed
    1. Adzhubei IA, Schmidt S, Peshkin L, Ramensky VE, Gerasimova A, Bork P, Kondrashov AS, and Sunyaev SR (2010). A method and server for predicting damaging missense mutations. Nat Methods 7, 248–249. - PMC - PubMed
    1. Balakrishnan L, and Bambara RA (2013). Flap endonuclease 1. Annu Rev Biochem 82, 119–138. - PMC - PubMed
    1. Bennardo N, Cheng A, Huang N, and Stark JM (2008). Alternative-NHEJ is a mechanistically distinct pathway of mammalian chromosome break repair. PLoS Genet 4, e1000110. - PMC - PubMed
    1. Bhatia V, Barroso SI, Garcia-Rubio ML, Tumini E, Herrera-Moyano E, and Aguilera A (2014). BRCA2 prevents R-loop accumulation and associates with TREX-2 mRNA export factor PCID2. Nature 511, 362–365. - PubMed

Publication types

MeSH terms