. 2019 Feb:40:184-197.
doi: 10.1016/j.ebiom.2019.01.036. Epub 2019 Jan 25.

Loss of SLC25A11 causes suppression of NSCLC and melanoma tumor formation

Affiliations

Loss of SLC25A11 causes suppression of NSCLC and melanoma tumor formation

Jae-Seon Lee et al. EBioMedicine. 2019 Feb.

Abstract

Background: Fast growing cancer cells require greater amounts of ATP than normal cells. Although glycolysis was suggested as a source of anabolic metabolism based on lactate production, the main source of ATP to support cancer cell metabolism remains unidentified.

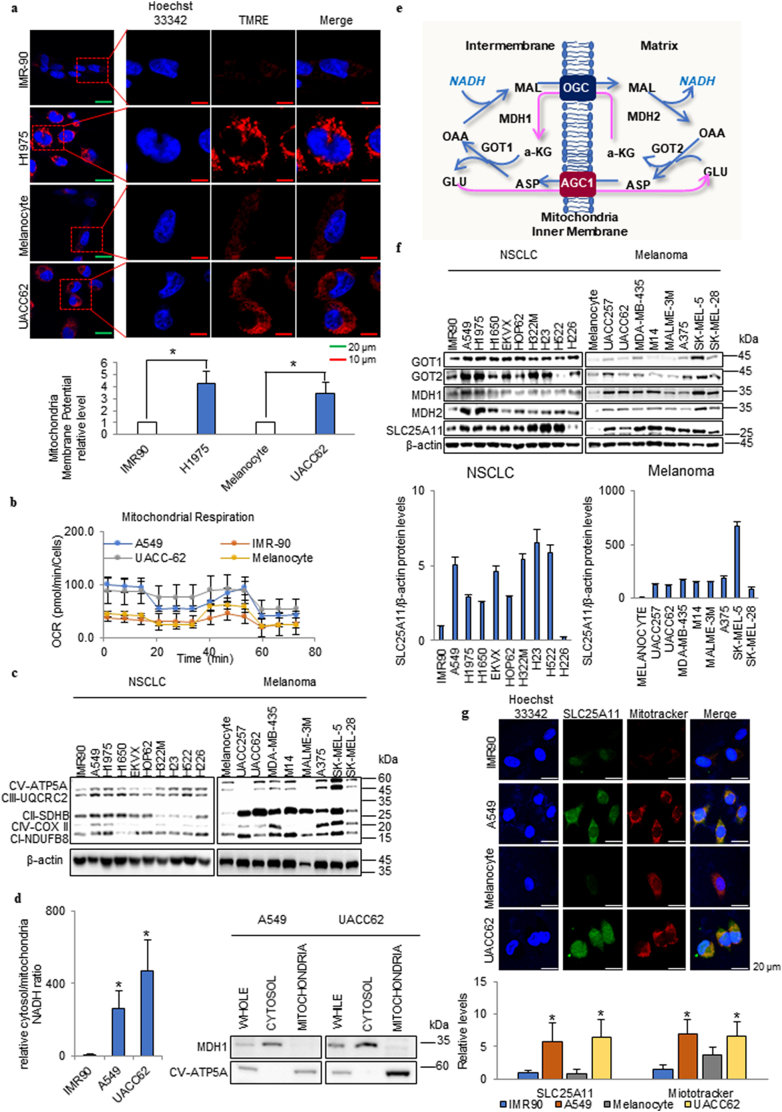
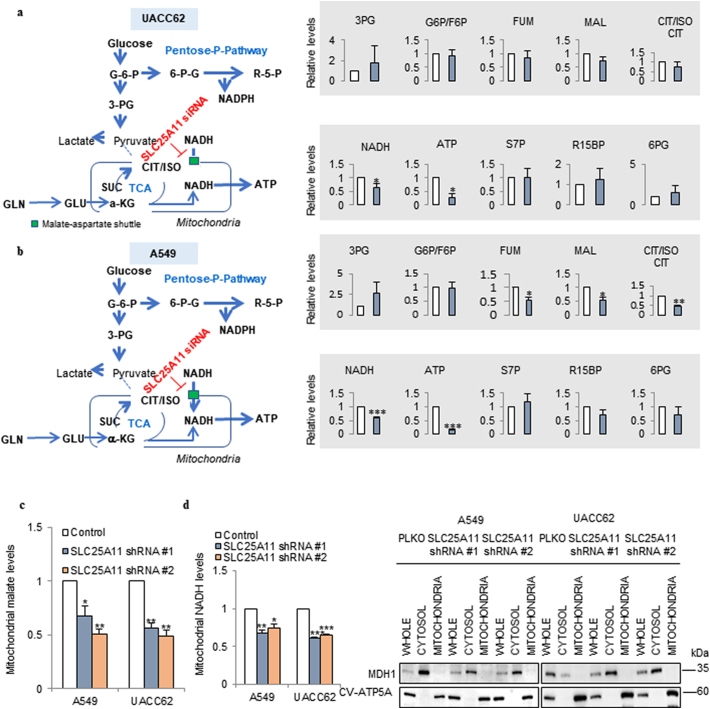
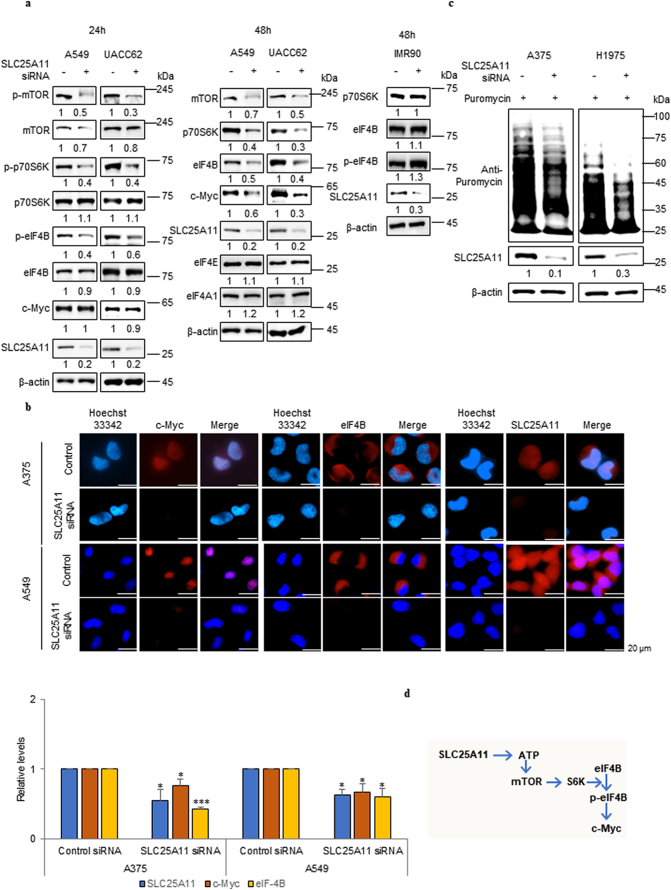
Methods: We have proposed that the oxoglutarate carrier SLC25A11 is important for ATP production in cancer by NADH transportation from the cytosol to mitochondria as a malate. We have examined not only changes of ATP and NADH but also changes of metabolites after SLC25A11 knock down in cancer cells.

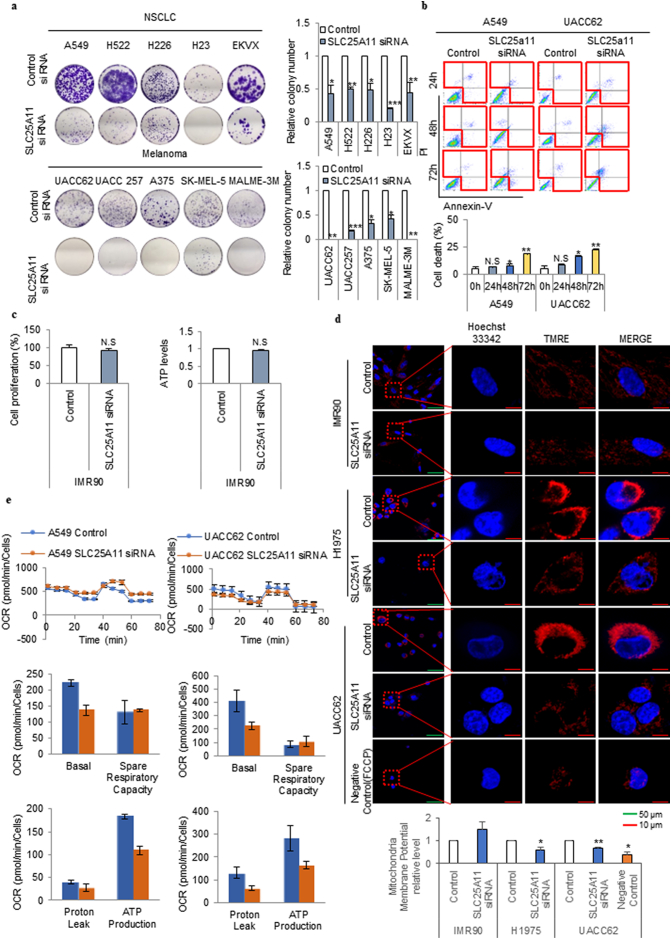
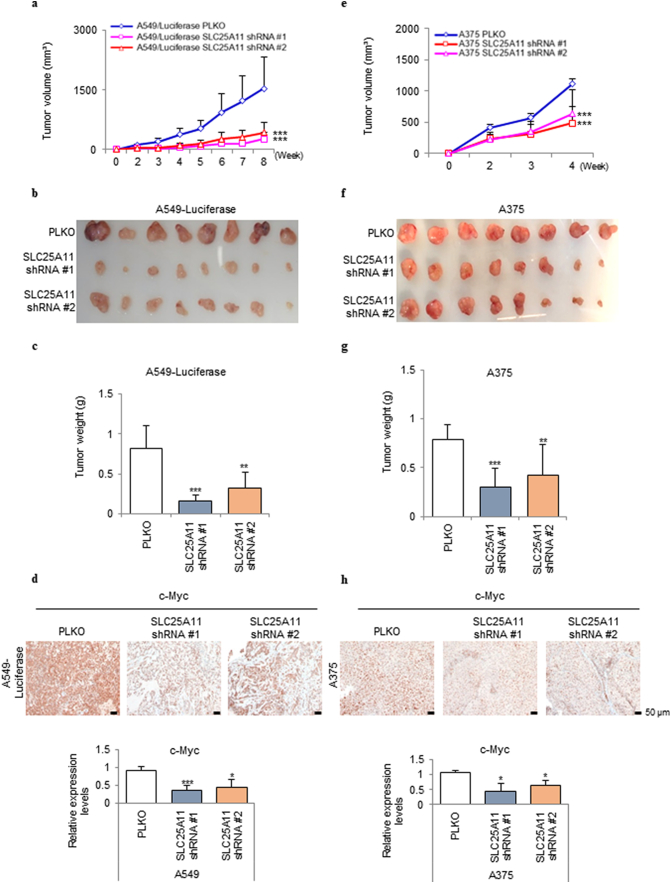
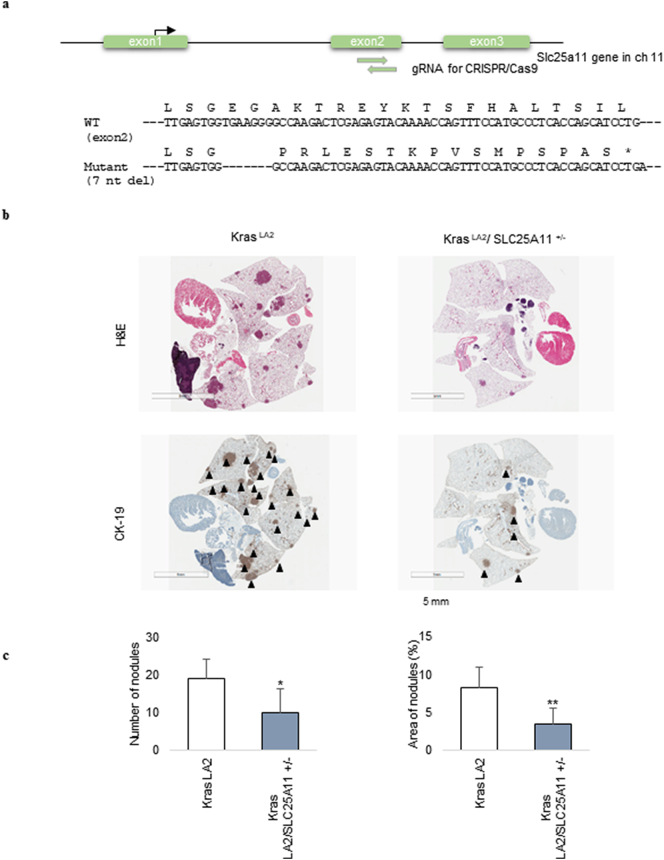
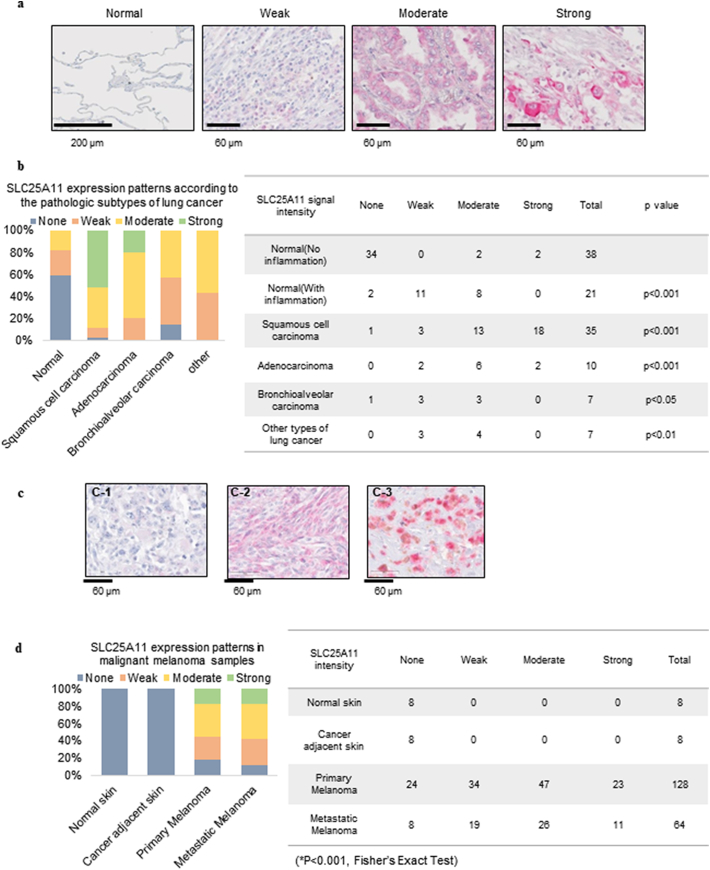
Findings: The mitochondrial electron transport chain was functionally active in cancer cells. The cytosolic to mitochondrial NADH ratio was higher in non-small cell lung cancer (NSCLC) and melanoma cells than in normal cells. This was consistent with higher levels of the oxoglutarate carrier SLC25A11. Blocking malate transport by knockdown of SLC25A11 significantly impaired ATP production and inhibited the growth of cancer cells, which was not observed in normal cells. In in vivo experiments, heterozygote of SLC25A11 knock out mice suppressed KRASLA2 lung tumor formation by cross breeding.

Interpretation: Cancer cells critically depended on the oxoglutarate carrier SLC25A11 for transporting NADH from cytosol to mitochondria as a malate form for the purpose of ATP production. Therefore blocking SLC25A11 may have an advantage in stopping cancer growth by reducing ATP production. FUND: The Basic Science Research Program through the National Research Foundation of Korea funded by the Ministry of Science and ICT to SYK (NRF-2017R1A2B2003428).

Keywords: Cancer metabolism; Cancer therapeutic target; Malate aspartate shuttle; Oxoglutarate carrier; SLC25A11.


Figures

Fig. 1
Fig. 1
High SLC25A11 levels increased the mitochondrial membrane potential in cancer cells. (a) The mitochondrial membrane potential was analyzed by live cell imaging in cancer cell lines in comparison with normal cells using ZEN software (scale bar, 20 μm, 10 μm). (b) The oxygen consumption rate (OCR) was analyzed using the Seahorse XFe analyzer in cancer cell lines compared to normal cells and then normalized by SRB assay. (c) The expression levels of oxidative phosphorylation (OxPhos) components were analyzed in NSCLC and melanoma cells by immunoblotting. (d) Cytosolic/mitochondrial NADH ratio in cancer cell lines compared with normal cells. Western blot confirming the isolation of mitochondria from cytosol with MDH1 (cytosol marker) and CV-ATP5A (mitochondria marker) antibodies. (e) Malate-aspartate shuttle (MAS) for NADH transportation into the mitochondrial matrix. MAT, malate-α-ketoglutarate transporter; GAT, glutamate-aspartate transporter; OAA, oxaloacetate; α-KG, α-ketoglutarate. (f) The expression levels of SLC25A11, GOT1, GOT2, MDH1, and MDH2 in NSCLC and melanoma cells were analyzed by immunoblotting and quantified by ImageJ. (g) Comparison of SLC25A11 expression in cancer cells and normal cells by immunofluorescence staining and intensity analyzed by ZEN software (scale bar = 20 μm). (Data were presented as mean ± SD. ***p < .001, **p < .01, *p < .05).
Fig. 2
Fig. 2
Metabolite analysis of SLC25A11 knockdown cancer cells revealed that the MAS is responsible for ATP production in cancer cells. (a, b) Targeted LC-MS/MS metabolite analysis in UACC62 (a) and A549 (b) cells treated with siRNA against SLC25A11 (40 nM) for 24 h. Metabolite levels were measured in triplicate and normalized by BCA assay. (c) Mitochondrial malate levels were measured in SLC25A11-knockdown A549 and UACC62 cells using a mitochondrial fractionation kit and malate assay kit. (d) Mitochondrial NADH levels were measured in SLC25A11-knockdown A549 and UACC62 cells using a mitochondrial fractionation kit and NADH assay kit. Western blot confirming the isolation of mitochondria from cytosol with MDH1 (cytosol marker) and CV-ATP5A (mitochondria marker) antibodies. (Data were presented as mean ± SD. ***p < .001, **p < .01, *p < .05).
Fig. 3
Fig. 3
SLC25A11 knockdown induced cell death following cell growth arrest through OxPhos reduction in melanoma and NSCLC cells. (a) Clonogenic assay was performed in NSCLC, and melanoma cells were treated with control or SLC25A11 siRNA (40 nM) for 2 weeks. (b) Cell death was measured using an Annexin V staining kit in cells treated with SLC25A11 siRNA (40 nM) for the indicated times. (c) Cell proliferation assay using SRB assay and ATP assay were performed with IMR90 cells by transfection of SLC25A11 siRNA (40 nM) or control siRNA for 48 h. (d) The mitochondrial membrane potential of H1975, UACC62, and IMR90 cells treated with SLC25A11 siRNA for 48 h was analyzed by live cell imaging using ZEN software (scale bar, 50 μm, 10 μm). (e) The oxygen consumption rate was analyzed using the Seahorse XFe analyzer in A549 and UACC62 cells treated with control or SLC25A11 siRNA (40 nM) for 24 h and then normalized by SRB assay. (Data were presented as mean ± SD. ***p < .001, **p < .01, *p < .05).
Fig. 4
Fig. 4
Knockdown of SLC25A11 inhibited protein translation by inactivating eIF4B. (a) Western blot was performed against phosphorylated mTOR, p70S6K, eIF4B and c-Myc in SLC25A11 knockdown cells and quantification was performed by ImageJ software. (b) Immunofluorescence was performed against eIF4B and c-Myc expression in SLC25A11 knockdown cells and the intensity was analyzed by ZEN software. (scale bar, 20 μm). (c) The indicated cells were treated with SLC25A11 siRNA for 48 h followed by 15 min incubation with puromycin (2 μg/ml). Cell lysates were subjected to immunoblotting using anti-puromycin antibody (SUnSET assay). (d) Possible regulation pathway of SLC25A11. (Data were presented as mean ± SD. ***p < .001, **p < .01, *p < .05).
Fig. 5
Fig. 5
SLC25A11 knockdown reduced NSCLC and melanoma tumor growth in vivo. (a) Volume of subcutaneous tumors derived from SLC25A11 shRNA transduced A549 cells. (b) Representative images of tumors derived from SLC25A11 shRNA transduced A549 cells. (c) Weight of subcutaneous tumors derived from SLC25A11 shRNA transduced A549 cells. (d) Immunohistochemical (IHC) analysis of c-Myc in A549 xenograft tumor tissues and quantification by positive cell counting. (e) Volume of subcutaneous tumors derived from SLC25A11 shRNA transduced A375 cells. (f) Representative images of tumors derived from SLC25A11 shRNA transduced A375 cells. (g) Weight of subcutaneous tumors derived from SLC25A11 shRNA transduced A375 cells. (h) IHC analysis of c-Myc in A375 xenograft tumor tissues and quantification by positive cell counting. (scale bar, 50 μm). (Data were analyzed statistically by two-way analysis of variance ANOVA tests using GraphPad PRISM 5 ***p < .001, **p < .01, *p < .05).
Fig. 6
Fig. 6
Genetic loss of SLC25A11 suppressed Kras-mediated lung tumorigenesis. (a) Generation of Slc25a11 knockout mice. A mixture of Cas9 protein and two guide RNAs (gRNA) was injected into the cytoplasm of mouse pronuclei. Mutations in mice were identified by TA cloning and sequencing. A 7 nt deletion in exon 2 of Slc25a11 causes premature translation termination. (b) Representative photomicrographs of tumor nodules detected by haematoxylin and eosin (H&E) and CK-19 staining (scale bar, 5 mm). (c) Quantitative analysis of tumor nodule number and tumor area showed a statistically significant decrease in these parameters in KRASLA2/SLC25A11+/− mice compared with KRASLA2 mice. (Data were analyzed statistically by two-way analysis of variance (ANOVA) tests using GraphPad PRISM 5 ***p < .001, **p < .01, *p < .05).
Fig. 7
Fig. 7
Expression and distribution of SLC25A11 in lung cancer and malignant melanoma tissue samples. (a) Tissue microarray was performed to determine the expression of SLC25A11 in normal lung tissues and lung cancer samples. A-1: Normal lung tissue showing no staining (×200; scale bar, 200 μm); A-2: Weak, A-3: Moderate, and A-4: Strong expression of SLC25A11 in lung cancer samples (×400; scale bar, 60 μm). (b) Percent distribution (graph) and SLC25A11 expression patterns in normal and cancer samples (Table) according to histologic subtypes. Statistical significance compared with normal lung tissues was determined by Fisher's exact test. (c) The expression patterns of SLC25A11 in malignant melanoma were determined by IHC. A-1: Weak, A-2: Moderate, A-3: Strong (×400; scale bar, 60 μm). (d) Percent SLC25A11 expression in normal skin and malignant melanoma samples. (Statistical significance was calculated by Fisher's Exact test. ***p < .001, **p < .01, *p < .05).

References

    1. Warburg O. On respiratory impairment in cancer cells. Science. 1956;124(3215):269–270. - PubMed
    1. Weinhouse S. On respiratory impairment in cancer cells. Science. 1956;124(3215):267–269. - PubMed
    1. DeBerardinis R.J., Chandel N.S. Fundamentals of cancer metabolism. Sci Adv. 2016;2(5) - PMC - PubMed
    1. DeBerardinis R.J., Mancuso A., Daikhin E., Nissim I., Yudkoff M., Wehrli S. Beyond aerobic glycolysis: transformed cells can engage in glutamine metabolism that exceeds the requirement for protein and nucleotide synthesis. Proc Natl Acad Sci U S A. 2007;104(49):19345–19350. - PMC - PubMed
    1. Smolkova K., Bellance N., Scandurra F., Genot E., Gnaiger E., Plecita-Hlavata L. Mitochondrial bioenergetic adaptations of breast cancer cells to aglycemia and hypoxia. J Bioenerg Biomembr. 2010;42(1):55–67. - PubMed

MeSH terms

Substances