. 2019 Mar 21;26(3):420-432.e9.
doi: 10.1016/j.chembiol.2018.11.016. Epub 2019 Jan 24.

Exogenous Monounsaturated Fatty Acids Promote a Ferroptosis-Resistant Cell State

Affiliations

Exogenous Monounsaturated Fatty Acids Promote a Ferroptosis-Resistant Cell State

Leslie Magtanong et al. Cell Chem Biol. .

Abstract

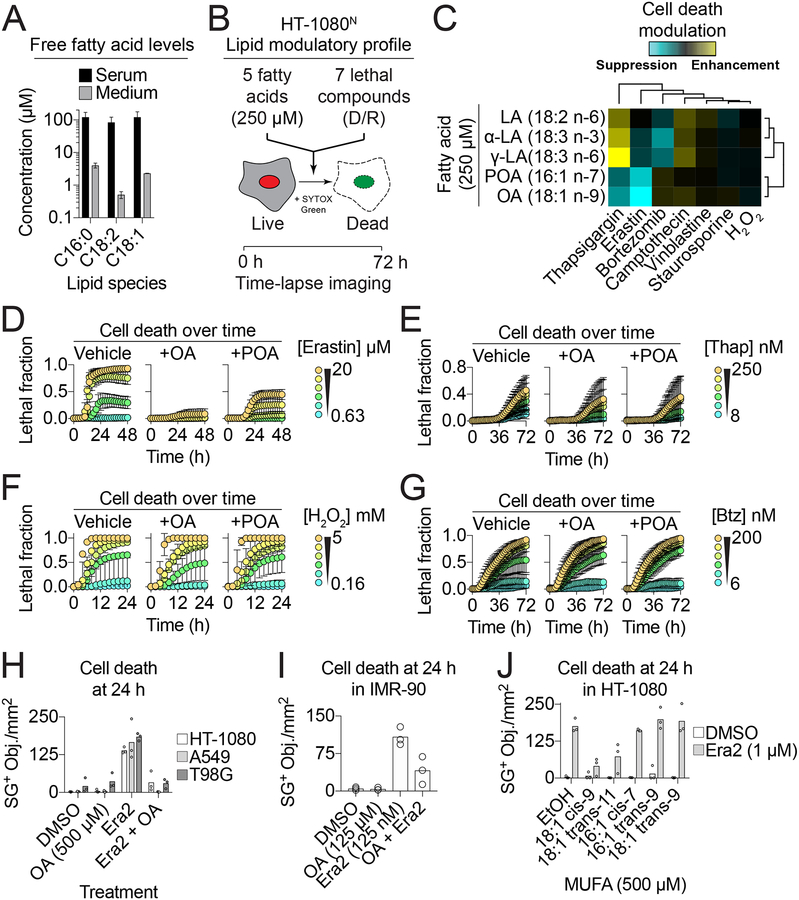
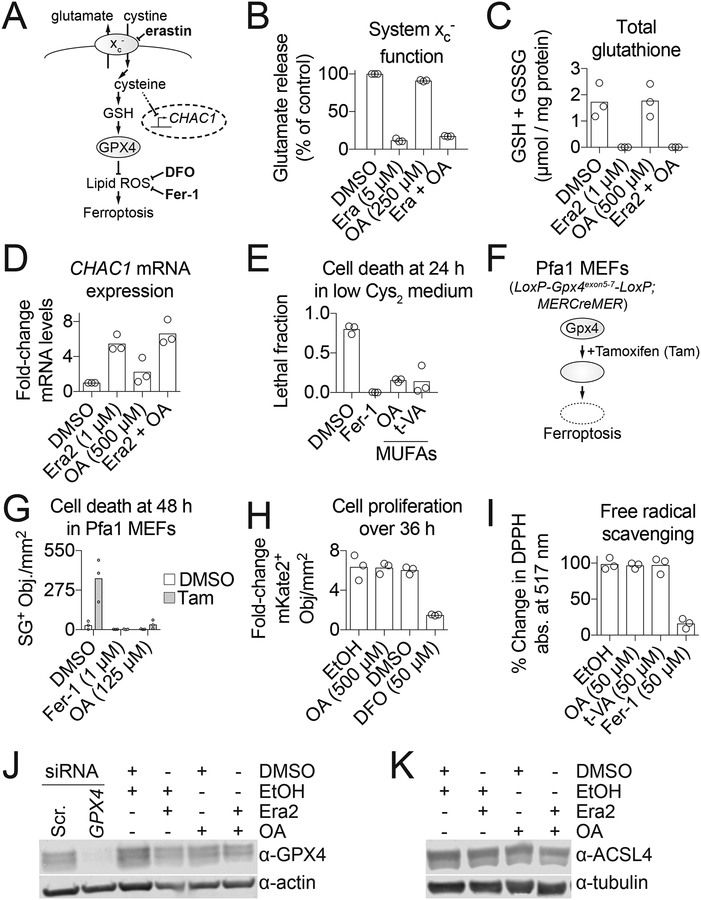
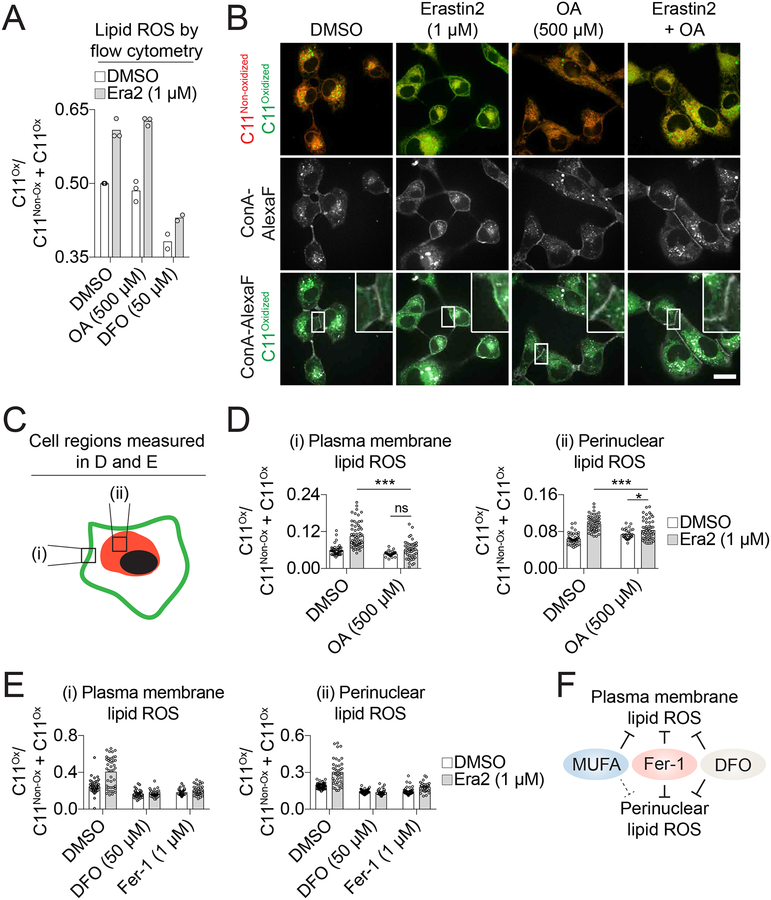
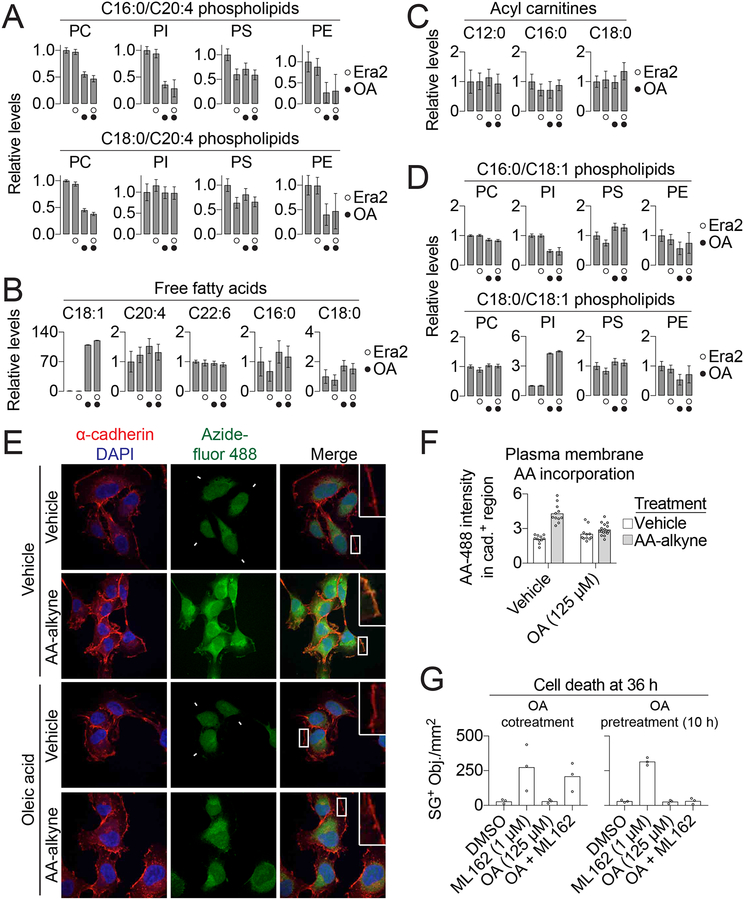
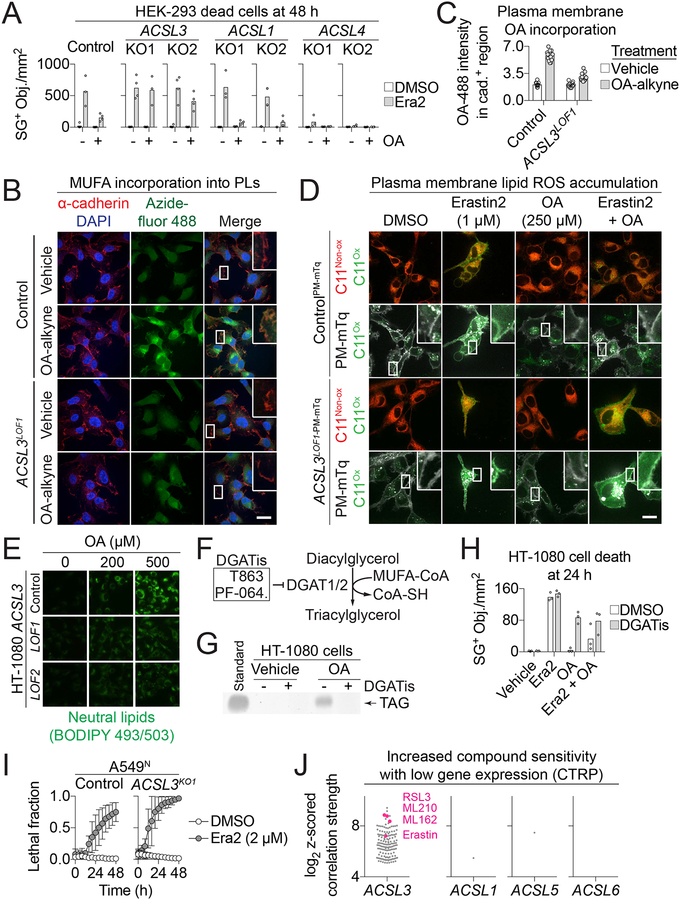
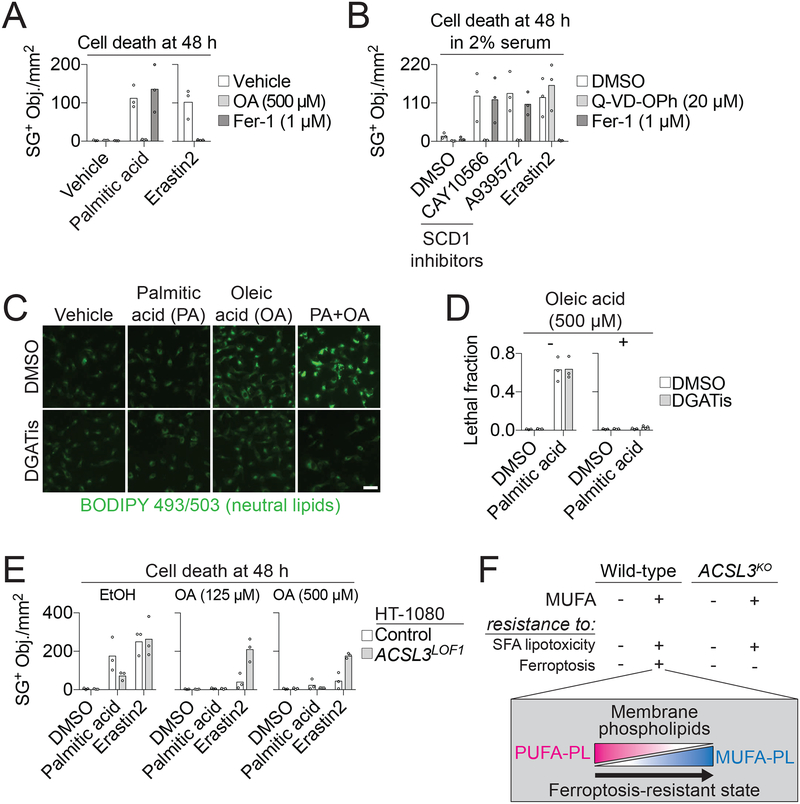
The initiation and execution of cell death can be regulated by various lipids. How the levels of environmental (exogenous) lipids impact cell death sensitivity is not well understood. We find that exogenous monounsaturated fatty acids (MUFAs) potently inhibit the non-apoptotic, iron-dependent, oxidative cell death process of ferroptosis. This protective effect is associated with the suppression of lipid reactive oxygen species (ROS) accumulation at the plasma membrane and decreased levels of phospholipids containing oxidizable polyunsaturated fatty acids. Treatment with exogenous MUFAs reduces the sensitivity of plasma membrane lipids to oxidation over several hours. This effect requires MUFA activation by acyl-coenzyme A synthetase long-chain family member 3 (ACSL3) and is independent of lipid droplet formation. Exogenous MUFAs also protect cells from apoptotic lipotoxicity caused by the accumulation of saturated fatty acids, but in an ACSL3-independent manner. Our work demonstrates that ACSL3-dependent MUFA activation promotes a ferroptosis-resistant cell state.

Keywords: GPX4; MUFAs; cell death; ferroptosis; iron; lipid ROS; lipid droplet; lipotoxicity; oleate.


Conflict of interest statement

Declaration of interests

S.J.D. is a member of the scientific advisory board of Ferro Therapeutics.

Figures

Figure 1.
Figure 1.. Exogenous monounsaturated fatty acids suppress ferroptosis.
(A) Fatty acid levels reported in adult human serum (Serum, (Psychogios et al., 2011)) or measured in three independent samples of DMEM + 10% FBS tissue culture medium (Medium). (B) Overview of the lipid modulatory profiling experiment in HT-1080N cells. (C) A cell death lipid modulation map. LA: linoleic acid, α-LA: α-linolenic acid, γ-LA: γ-linolenic acid, POA: palmitoleic acid, OA: oleic acid, H2O2: hydrogen peroxide. (D-G) Cell death (lethal fraction) over time, extracted from (C), for erastin (D), thapsigargin (Thaps.) (E), H2O2 (F) and bortezomib (Bortez.) (G) ± OA or POA. (H) SYTOX Green positive (SG+) object (i.e. dead cell) counts in HT-1080, A549 and T98G cells treated ± erastin2 (era2) ± OA. Era2 = 1 μM (HT-1080, T98G) or 2 μM (A549). (I) Dead cell counts in IMR-90 cells. (J) Dead cell counts in HT-1080 cells treated as indicated ± different monounsaturated fatty acids (MUFAs). Data in (A,D-G) are mean ± SD. Each data point in (H-J) represents an independent biological replicate (n=3).
Figure 2.
Figure 2.. MUFAs prevent ferroptosis downstream of GPX4 activity.
(A) Schematic of the ferroptosis pathway. (B) Glutamate release, a measure of system xc activity, following 2 h compound treatment. Era: erastin, OA: oleic acid. (C) Total glutathione levels assayed using Ellman’s reagent at 11 h. Era2: erastin2. (D) RT-qPCR analysis of CHAC1 mRNA levels at 6 h. (E) Cell death (lethal fraction) of HT-1080N cells in low cystine (Cys2) medium. Fer-1: ferrostatin-1, 1 μM; MUFA: monounsaturated fatty acid; OA, 500 μM; t-VA: trans-vaccenic acid, 500 μM. (F) Schematic of inducible Gpx4 loss in Pfa1 mouse embryonic fibroblasts (MEFs). (G) Cell death of Pfa1 MEFs ± tamoxifen citrate (Tam, 1 μM). (H) Fold-change of HT-1080N live cells (mKate2+ counts). (I) Cell-free free radical scavenging tested using the 2,2-diphenyl-1-picrylhydrazyl (DPPH) assay. (J,K) GPX4 (J) and ACSL4 (K) protein levels assessed by Western blotting. Compound treatments were for 10 h prior to cell pellet harvest. Era2, 1 μM; OA, 500 μM. Each data point represents an independent biological (B-H) or technical (I) replicate (n=3). Western blots in (J) and (K) were performed twice and results from one blot are shown.
Figure 3.
Figure 3.. OA preferentially decreases lipid reactive oxygen species (ROS) at the plasma membrane.
(A) Analysis of lipid ROS using C11 BODIPY 581/591 (C11) by flow cytometry in HT-1080 cells treated for 10 h. Each data point represents the ratio of oxidized (C11Ox) to total (non-oxidized C11 (C11Non-ox) + C11Ox) signal from an independent biological replicate (n=3). Era2: erastin2, DFO: deferoxamine, OA: oleic acid. (B) Confocal imaging of C11 in HT-1080 cells. After compound treatment for 10 h, cells were labeled with C11 (5 μM) and Concanavalin A, Alexa Fluor 350 (ConA-AlexaF, 25 μg/mL). Arrowheads indicate regions of highly oxidized C11 and/or ConA-AlexaF labeling. C11Non-ox: non-oxidized C11, C11Ox: oxidized C11. Scale bar = 20 μm. Images from one of four independent experiments are shown. (C) Schematic showing the two regions of the cell that were quantified in (D) and (E). (D,E) Quantification of (i) plasma membrane and (ii) perinuclear ratios of C11Ox. Fer-1: ferrostatin-1. Each data point represents an individual cell quantified in one of two (Fer-1-treated samples) or four (all other conditions) independent biological replicates. (F) Model summarizing the effects of ferroptosis inhibitors on lipid ROS accumulation.
Figure 4.
Figure 4.. Exogenous OA reduces PUFA-PL levels.
(A-D) Lipid levels determined by mass spectrometry in HT-1080 cells treated for 10 h ± erastin2 (Era2, 1 μM) ± oleic acid (OA, 500 μM). PC: phosphatidylcholine, PI: phosphatidylinositol, PS: phosphatidylserine, PE: phosphatidylethanolamine. (E) Visualization of arachidonic acid (AA) localization. HT-1080 cells were incubated with arachidonic acid-alkyne (AA-alkyne, 20 μM) or vehicle control (ethanol, EtOH), and with either OA (conjugated to bovine serum albumin [BSA], 125 μM) or vehicle (BSA alone) for 2 h, then chased in medium containing only OA (125 μM) or vehicle for 10 h. AA-alkyne localization was visualized using copper-catalyzed click chemistry to azidefluor 488, to yield AA-488. The plasma membrane is identified by cadherin immunofluorescence. Scale bar = 20 μm. (F) Quantification of AA-488 fluorescence intensity within cadherin-positive (cad.+) regions. Each data point represents one field. The y-axis is in arbitrary units. Scale bar = 20 μm. (G) Cell death in HT-1080N cells either cotreated with OA and ML162 or pretreated for 10 h with OA prior to the addition of ML162. Data in (A-D) are mean ± SD of five independent biological replicates. AA-488 imaging and quantification (E) was performed on two independent biological replicates and results from one replicate are shown. Each data point in (G) represents an independent biological replicate (n = 3).
Figure 5.
Figure 5.. ACSL3 is required for OA-induced protection from ferroptosis.
(A) Dead cell counts (SG+ objects) in HEK-293 Control or ACSL1, 3, or 4 knockout (KO) cell lines treated ± erastin2 (Era2, 1 μM) ± oleic acid (OA, 125 μM). (B) HT-1080 Control and ACSL3LOF1 cells incubated ± oleic acid-alkyne (OA-alkyne, 20 μM) for 2 h, then chased in regular medium (no alkyne) for 2 h. Scale bar = 20 μm. (C) Quantification of AA-488 fluorescence intensity within cadherin-positive (cad.+) regions. Each data point represents one field. The y-axis is in arbitrary units. (D) Confocal imaging of C11 BODIPY 581/591 (C11) in HT-1080 ControlPM-mTq and ACSL3LOF1-PM-mTq cells after compound treatment for 24 h. Arrowheads indicate regions of highly oxidized C11 and/or plasma membrane-mTurquoise2 (PM-mTq) fluorescence. C11Non-ox: non-oxidized C11, C11Ox: oxidized C11. Scale bar = 20 m. (E) BODIPY 493/503 imaging of neutral lipid accumulation in HT-1080 Control and ACSL3LOF1/2 cells ± oleic acid (OA). Scale bar = 50 μm. (F) Schematic of triacylglycerol synthesis. DGATis is the combination of T863 (20 μM) and PF-06424439 (PF-064., 10 μM). FA: fatty acid. (G) Thin-layer chromatography of neutral lipid extracts from HT-1080 cells ± DGATis (6 h). TAG: triacylglycerol. (H) Dead cell counts in HT-1080 cells. Era2: 1 μM, OA: 500 μM. (I) Cell death ± erastin2 (Era2). (J) Significant correlations between low expression of ACSL genes and small molecule probe lethality from the Cancer Therapeutics Response Portal (CTRP) dataset. Each dot represent one compound. Ferroptosis-inducing compounds are highlighted in pink. Each data point in (A) and (H) represents an independent biological replicate (n ≥ 3). OA-488 imaging quantification (B), BODIPY 493/503 imaging (E) and TLC (G) were performed twice and results from one biological replicate are shown.
Figure 6.
Figure 6.. OA protects from apoptotic and ferroptotic cell death through distinct mechanisms.
(A) Dead cell counts in HT-1080 cells treated ± palmitic acid (200 μM) or erastin2 (1 μM). OA: oleic acid, Fer-1: ferrostatin-1. (B) Dead cell counts in HT-1080 cells treated in 2% serum-containing medium with CAY10566 (200 nM), A939572 (200 nM) or erastin2 (1 μM) ± Fer-1 or the pan-caspase inhibitor Q-VD-OPh. (C) Neutral lipid staining in HT-1080N cells treated for 6 h ± palmitic acid (PA, 200 μM) ± oleic acid (OA, 500 μM) ± DGATis (T863 [20 μM] and PF-06424439 [10 μM]). Scale bar = 50 μm. (D) Cell death in HT-1080N cells at 48 h treated ± oleic acid ± palmitic acid (200 μM) ± DGATis, as in panel C. (E) Cell death at 24 h with two different concentrations of OA ± palmitic acid (200 μM) or erastin2 (1 μM). (F) Model for how ACSL3-dependent MUFA activation generates a ferroptosis-resistant cell state by increasing the phospholipid MUFA to PUFA ratio. Each data point in (A,B,D,E) represents an independent biological replicate (n = 3). Imaging in (C) was performed twice and results from one experiment are shown.

Comment in

References

    1. Bailey AP, Koster G, Guillermier C, Hirst EMA, MacRae JI, Lechene CP, Postle AD, and Gould AP (2015). Antioxidant Role for Lipid Droplets in a Stem Cell Niche of Drosophila. Cell 163, 340–353. - PMC - PubMed
    1. Benjamin DI, Li DS, Lowe W, Heuer T, Kemble G, and Nomura DK (2015). Diacylglycerol Metabolism and Signaling Is a Driving Force Underlying FASN Inhibitor Sensitivity in Cancer Cells. ACS Chem. Biol 10, 1616–1623. - PMC - PubMed
    1. Cantor JR, Abu-Remaileh M, Kanarek N, Freinkman E, Gao X, Louissaint A, Lewis CA, and Sabatini DM (2017). Physiologic Medium Rewires Cellular Metabolism and Reveals Uric Acid as an Endogenous Inhibitor of UMP Synthase. Cell 169, 258–272.e17. - PMC - PubMed
    1. Das UN (1991). Tumoricidal action of cis-unsaturated fatty acids and their relationship to free radicals and lipid peroxidation. Cancer Lett. 56, 235–243. - PubMed
    1. Dixon SJ, Lemberg KM, Lamprecht MR, Skouta R, Zaitsev EM, Gleason CE, Patel DN, Bauer AJ, Cantley AM, Yang WS, et al. (2012). Ferroptosis: an iron-dependent form of nonapoptotic cell death. Cell 149, 1060–1072. - PMC - PubMed

Publication types

MeSH terms