. 2019 Mar 7;24(3):363-375.e9.
doi: 10.1016/j.stem.2018.12.013. Epub 2019 Jan 24.

Cholesterol Metabolism Is a Druggable Axis that Independently Regulates Tau and Amyloid-β in iPSC-Derived Alzheimer's Disease Neurons

Affiliations

Cholesterol Metabolism Is a Druggable Axis that Independently Regulates Tau and Amyloid-β in iPSC-Derived Alzheimer's Disease Neurons

Rik van der Kant et al. Cell Stem Cell. .

Abstract

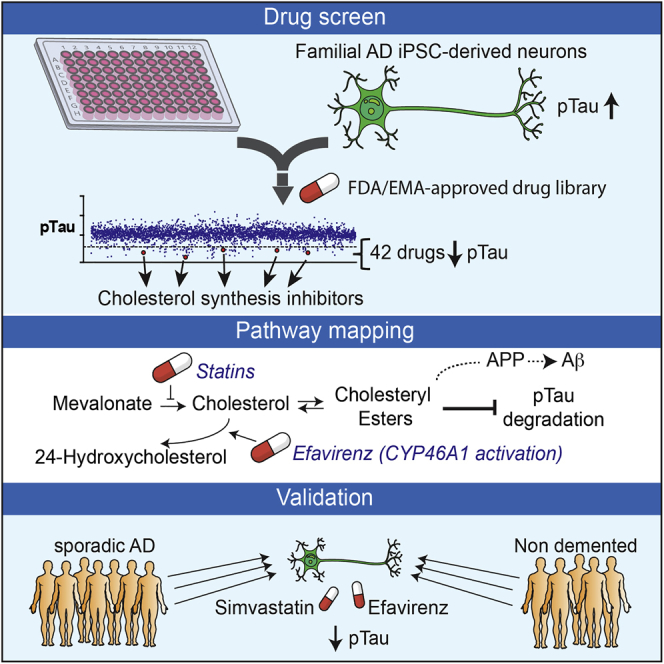
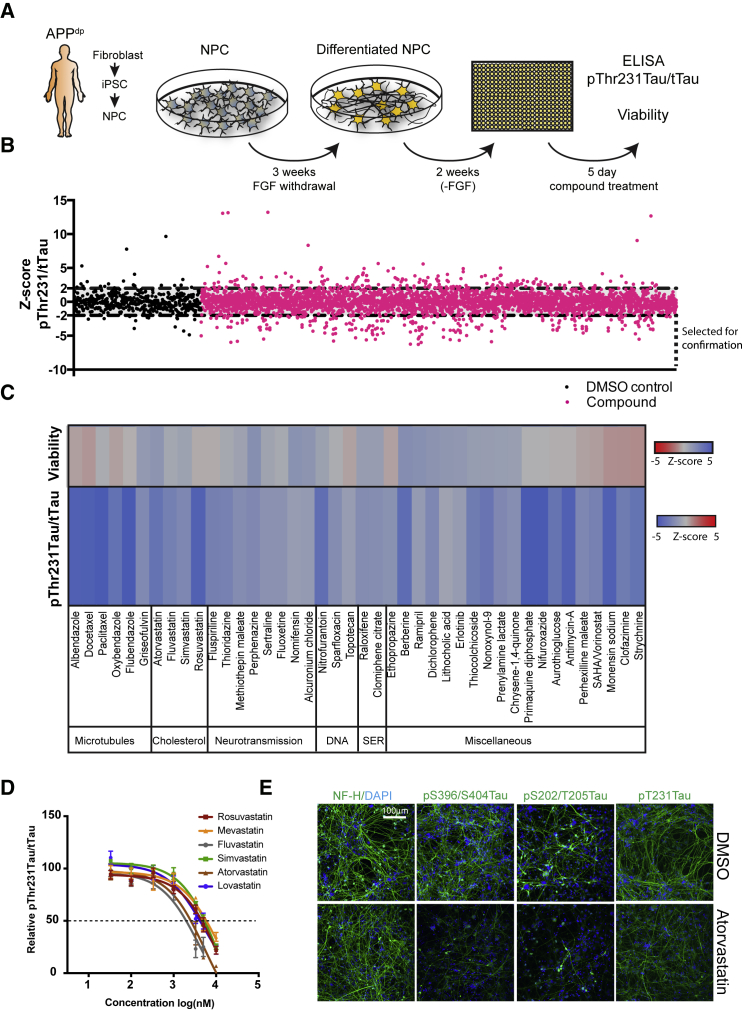
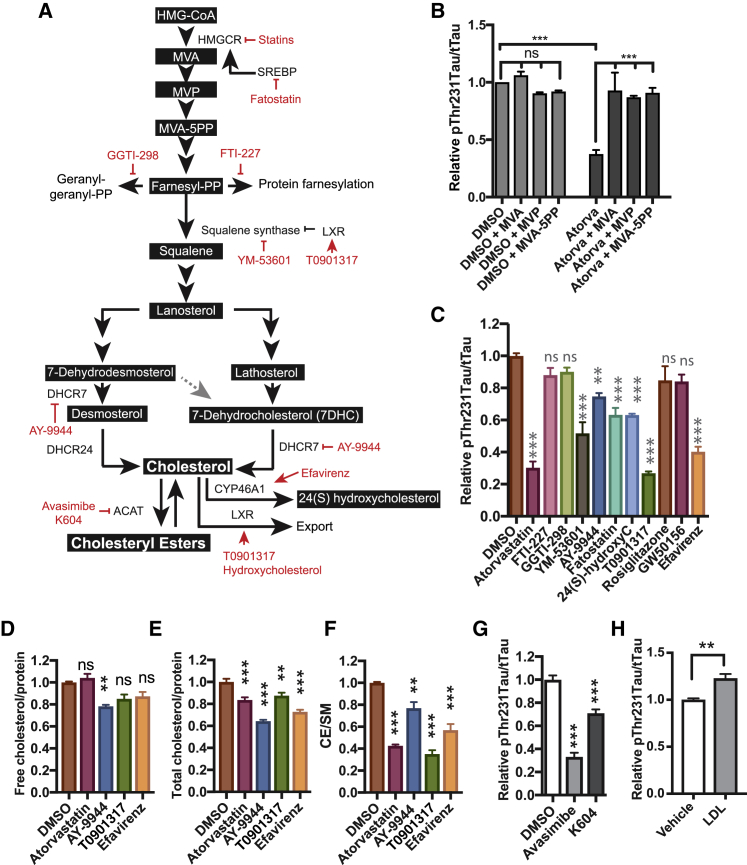
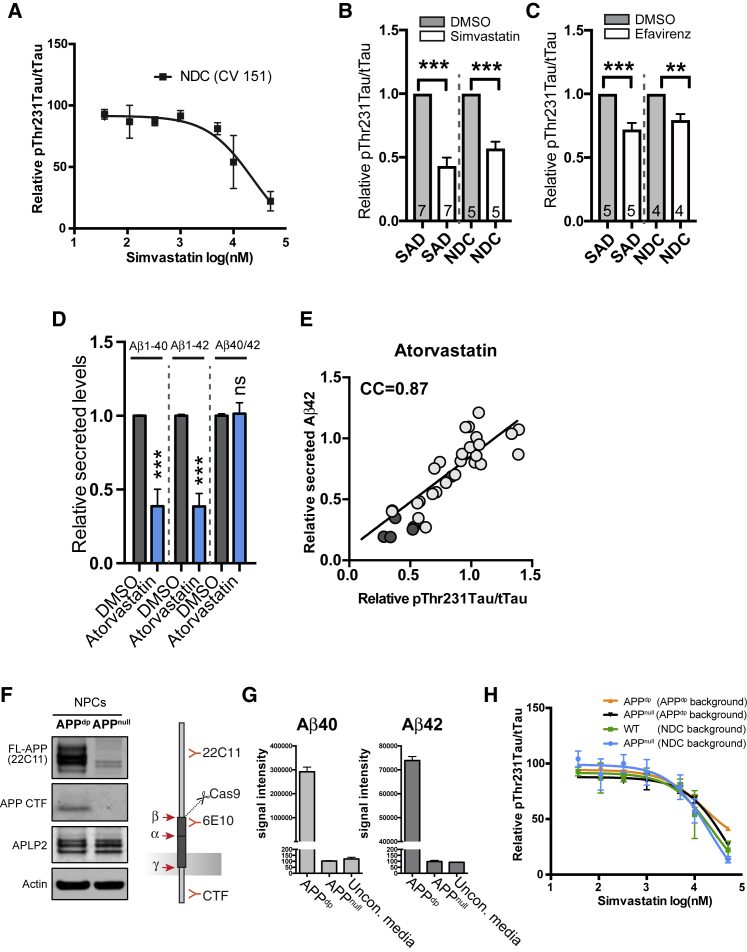
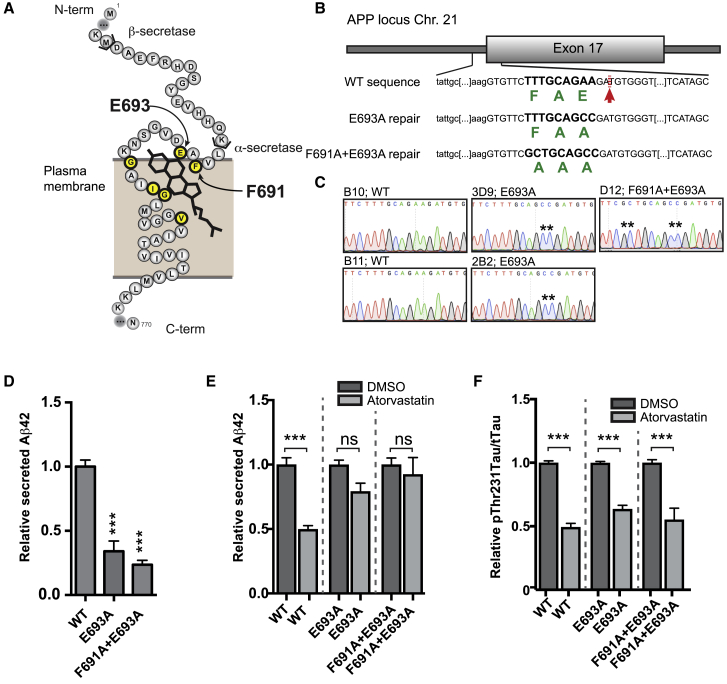
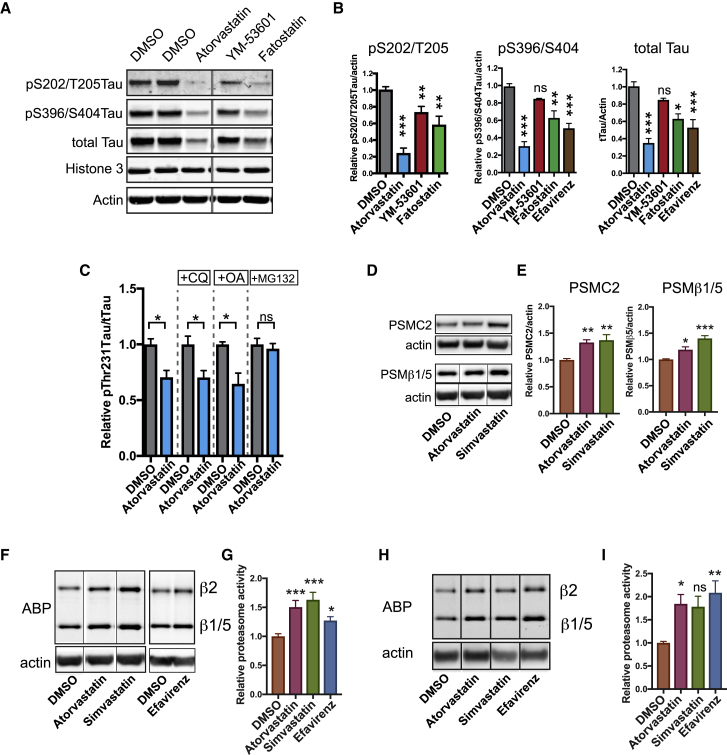
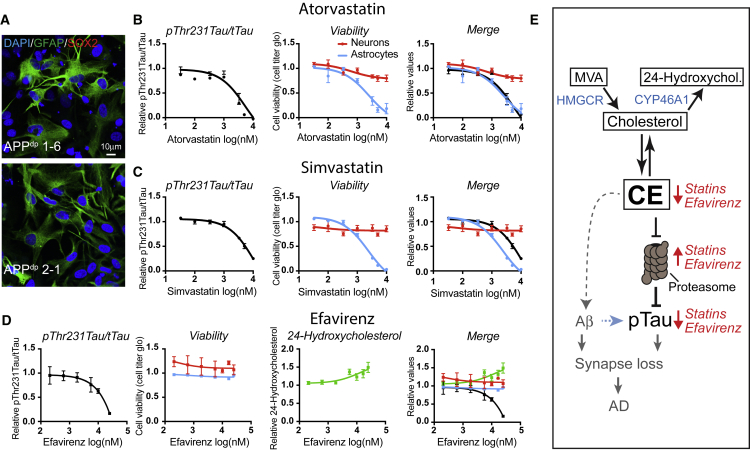
Genetic, epidemiologic, and biochemical evidence suggests that predisposition to Alzheimer's disease (AD) may arise from altered cholesterol metabolism, although the molecular pathways that may link cholesterol to AD phenotypes are only partially understood. Here, we perform a phenotypic screen for pTau accumulation in AD-patient iPSC-derived neurons and identify cholesteryl esters (CE), the storage product of excess cholesterol, as upstream regulators of Tau early during AD development. Using isogenic induced pluripotent stem cell (iPSC) lines carrying mutations in the cholesterol-binding domain of APP or APP null alleles, we found that while CE also regulate Aβ secretion, the effects of CE on Tau and Aβ are mediated by independent pathways. Efficacy and toxicity screening in iPSC-derived astrocytes and neurons showed that allosteric activation of CYP46A1 lowers CE specifically in neurons and is well tolerated by astrocytes. These data reveal that CE independently regulate Tau and Aβ and identify a druggable CYP46A1-CE-Tau axis in AD.

Keywords: Alzheimer’s disease; CYP46A1 Tau; amyloid beta; cholesterol metabolism; cholesteryl esters; disease modeling; drug screening; induced pluripotent stem cells; lipids; proteostasis.


Figures

None
Graphical abstract
Figure 1
Figure 1
Identification of Compounds that Decrease pTau Levels in FAD iPSC-Derived AD Neurons (A) Screening strategy overview: APPdp1-6 NPC’s were differentiated for 3 weeks, replated into 384 well plates, and after 2 weeks, treated with 5 μM of compound for 5 days; pThr231Tau/tTau ratio and cell viability was measured. (B) 1,684 compounds (in pink) were screened in duplicate for their effect on pThr231Tau/tTau ratio as expressed by Z score. 158 compounds that decreased pThr231/tTau by Z ≤ −2 were selected for confirmation. Vehicle alone controls (DMSO) are shown in black. (C) 42 confirmed non-toxic hits grouped by drug category. SER, selective estrogen reuptake (n = 4). (D) Dosage effects of different statins on pThr231Tau/tTau ratio in APPdp1-6 (mean ± SEM, n ≥ 3). (E) APPdp1-6 neurons were treated with vehicle (DMSO, upper row) or atorvastatin (10 μM, lower row) for 5 days and fixed and stained with antibodies for indicated antigens. NF-H, neurofilament H, axonal marker. The pThr231Tau antibody used is TG3, which detects a conformational epitope of pThr231Tau. Scale bar, 100 μm. See also Figure S1.
Figure 2
Figure 2
The Effect of Statins on pTau Is Mediated by Cholesteryl Esters (A) Overview of the mevalonate pathway and inhibitors used in this study. (B) APPdp1-6 neurons were treated with DMSO or atorvastatin (10 μM) for 5 days. For indicated conditions, mevalonate (MVA, 0.5 mM), mevalonate-5-phosphate (MVP, 0.5 mM), or mevalonate-5-pyrophosphate (MVA-5PP, 1 mM) was added to the media at a single dose at t = 0 (mean ± SEM, n ≥ 3). (C) APPdp1-6 neurons were treated with inhibitors of specific steps in the mevalonate pathway; atorvastatin (10 μM), FTI-227 (10 μM), GGTI (10 μM), YM-53601 (20 μM), AY-9944 (10 μM), fatostatin (20 μM), 24-hydroxycholesterol (10 μM), T0901317 (10 μM), rosiglitazone (50 μM), GW501516 (10 μM), and efavirenz (10 μM). pThr231Tau/tTau levels were determined by ELISA (mean ± SEM, n ≥ 3). (D–F) APPdp1-6 neurons were treated with atorvastatin (10 μM), AY-9944 (5 μM), T0901317 (10 μM), or efavirenz (10 μM) for 3 days and lipid analysis was performed to measure (D) free cholesterol (mean ± SEM, n ≥ 8), (E) total cholesterol (mean ± SEM, n ≥ 4), and (F) CE (mean ± SEM, n ≥ 8). (G) pThr231Tau/tTau levels after 5-day treatment of APPdp1-6 neurons with avasimibe (10 μM) or K604 (25 μM) (mean ± SEM, n ≥ 3). (H) Treatment of APPdp1-6 neurons with LDL (25 μg/mL) (mean ± SEM, n ≥ 3). See also Figure S2.
Figure 3
Figure 3
pTau and Aβ Are Co-regulated by CE through Separate Pathways (A) Dosage effect of simvastatin treatment on pThr231Tau/tTau on non-demented control (NDC) neurons (CV 151 line). (B and C) Effect of simvastatin (10 μM) (B) or efavirenz (10 μM) treatment (C) on pThr231Tau/tTau in neuronal lines from SAD and NDC subjects (mean ± SEM, number of individual patients indicated in bars). (D) Secreted Aβ levels from APPdp1-6 neurons treated with atorvastatin (10 μM) for 5 days normalized to DMSO-treated neurons (mean ± SEM, n ≥ 3). (E) Correlation of Aβ42 and pThr231Tau/tTau levels in atorvastatin-treated neurons at different time points, dosages, and in different cell lines (light circles, APPdp1-6; dark circles, APPdp2-1). CC, correlation coefficient. (F and G) Characterization of APPnull line. (F) Western blot with antibodies against APP in isogenic APPdp (line APPdp 2-1) and APPnull (line APPdp1KO). Full-length APP (FL) and APP CTF are no longer detected in the APPdp1null line. The FL-APP (22C11) cross reacts with APLP2 explaining the remaining signal in the FL-APP (22C11 blot). (G) ELISA analysis shows an absence of Aβ40 and Aβ42 in conditioned media from the APPnull line. Positive control is APPdp1-2, negative control is unconditioned media. The detection antibody for the ELISA is 6E10, as indicated in (F). (H) Dosage effect of simvastatin treatment on pThr231Tau/tTau on neurons with indicated genotypes (mean ± SEM, n ≥ 3). Isogenic knockouts used were in an APPdp patient genetic background (lines APPdp1-2 [dp] and APPdp1KO [null] or non-demented control [NDC] genetic background [CV line 151 (wild-type [WT])] and IB6 [null]). Mean ± SEM; n ≥ 5. See also Figure S3.
Figure 4
Figure 4
Regulation of Aβ by CE Is Mediated by a Cholesterol Binding Domain in APP (A) Schematic representation of the transmembrane domain of APP with amino acids essential for cholesterol binding indicated in yellow. (B) Schematic overview of the gene-editing strategy to generate APP-Δcholesterol lines. Green indicates amino acid sequence. Red arrow indicates CRISPR/Cas9 cut site. (C) Sequencing results verifying correct incorporation of desired mutations in the APP-Δcholesterol lines. Two E693A (line 3D9 and 2B2) and one F691A+E693A line (line D12) were generated, as well as two non-gene-edited, but clonally expanded, WT lines (B10 and B11). (D–F) Measurements made using APP-Δcholesterol neurons with the following genotypes: WT (average from 2 independent lines), E693A (2 independent lines), and F691A+E693A (1 line) (mean ± SEM, n ≥ 3 per line). (D) Relative secreted Aβ42 levels in conditioned media from purified CD184, CD44, and CD24+ neurons (mean ± SEM, n ≥ 3 per line). (E) Relative secreted Aβ42 in response to atorvastatin treatment (10 μM, 3 days) (mean ± SEM, n ≥ 3 per line) (F) pThr231Tau/tTau in response to atorvastatin treatment (10 μM, 3 days) in APP-Δcholesterol neurons (mean ± SEM, n ≥ 3 per line). See also Figure S4.
Figure 5
Figure 5
Regulation of pTau by CE Is Mediated by the Proteasome (A and B) The effect of CE lowering treatments on Tau levels and Tau phosphorylation as assessed by western blot (A), quantified in (B) (mean ± SEM, n ≥ 3). Image is a composite of different loading positions on same blot, stitch is indicated by vertical line. (C) pThr231Tau/tTau levels in APPdp1-6 neurons co-treated with atorvastatin (10 μm) and a lysosomal inhibitor (chloroquine, CQ 25 μM), a phosphatase inhibitor (okadaic acid, 1.25nM) or a proteasome inhibitor (MG132, 5 μM) for 3 days as measured by ELISA (mean ± SEM, n ≥ 3). (D and E) APPdp1-6 neurons were treated for 3 days with DMSO, simvastatin (10 μM) or atorvastatin (10 μM) and levels of proteasome subunits PSMC2 and PSMβ1/5 were assessed by western blot (D). Quantified in (E) (mean ± SEM n ≥ 3). PSMβ1/5/actin image is a composite of different loading positions on same blot, stiches are indicated by vertical line. (F–I) APPdp1-6 (F and G) or NDC CV4a (H and I) neurons were treated for 3 days with DMSO, simvastatin (10 μM), atorvastatin (10 μM), or efavirenz (10 μM) and incubated with a proteasome activity binding probe (ABP) for 1 h. Cells were lysed, run on SDS-page, and ABP fluorescence from the gel was determined (mean ± SEM, n ≥ 5). (G) Quantification of the western blots from (F). (I) Quantification of western blots from (H). Images are composite of different loading positions on same blot, stiches are indicated by vertical lines. See also Figure S5.
Figure 6
Figure 6
CYP46A1 Activation Is a Neuron-Specific CE-Reducing Approach that Is Better Tolerated by Astrocytes (A) iPSC-derived astrocytes were fixed and stained with indicated antibodies. Scale bar, 10 μm. (B–D) iPSC-derived APPdp1-6 astrocytes were treated for 3 days with increasing concentrations of (B) atorvastatin, (C) simvastatin, and (D) efavirenz, and viability was measured (cell titer glo). Astrocytic viability (blue line) was plotted against results from Figures 1D and S1A for statins (neuronal viability and pThr231Tau/Tau ratio). For efavirenz, dose responses to measure pThr231Tau/tTau and neuronal viability were performed in APPdp1-6 neurons (mean ± SEM, n ≥ 3–6). (E) Model depicting the relationship between CE, pTau, and Aβ in early AD neurons. Statins reduce CE levels through inhibition of the cholesterol-synthetic pathway, while efavirenz enhances the turnover of cholesterol to 24-hydroxycholesterol that causes conversion of CE to cholesterol and a reduction in CE. Reduced CE cause proteasomal upregulation and degradation of pTau. In a correlated, but independent pathway, CE regulate APP processing and Aβ generation. See also Figure S6.

Comment in

References

    1. Anderson K.W., Mast N., Hudgens J.W., Lin J.B., Turko I.V., Pikuleva I.A. Mapping of the allosteric site in cholesterol hydroxylase CYP46A1 for efavirenz, a drug that stimulates enzyme activity. J. Biol. Chem. 2016;291:11876–11886. - PMC - PubMed
    1. Apostolova N., Blas-Garcia A., Galindo M.J., Esplugues J.V. Efavirenz: what is known about the cellular mechanisms responsible for its adverse effects. Eur. J. Pharmacol. 2017;812:163–173. - PubMed
    1. Arrese E.L., Saudale F.Z., Soulages J.L. Lipid droplets as signaling platforms linking metabolic and cellular functions. Lipid Insights. 2014;7:7–16. - PMC - PubMed
    1. Barrett P.J., Song Y., Van Horn W.D., Hustedt E.J., Schafer J.M., Hadziselimovic A., Beel A.J., Sanders C.R. The amyloid precursor protein has a flexible transmembrane domain and binds cholesterol. Science. 2012;336:1168–1171. - PMC - PubMed
    1. Berkers C.R., van Leeuwen F.W.B., Groothuis T.A., Peperzak V., van Tilburg E.W., Borst J., Neefjes J.J., Ovaa H. Profiling proteasome activity in tissue with fluorescent probes. Mol. Pharm. 2007;4:739–748. - PubMed

Publication types