Multicenter Study
. 2019 Feb 11;35(2):267-282.e7.
doi: 10.1016/j.ccell.2018.12.010. Epub 2019 Jan 24.

Integration of Genomic and Transcriptional Features in Pancreatic Cancer Reveals Increased Cell Cycle Progression in Metastases

Affiliations
Multicenter Study

Integration of Genomic and Transcriptional Features in Pancreatic Cancer Reveals Increased Cell Cycle Progression in Metastases

Ashton A Connor et al. Cancer Cell. .

Abstract

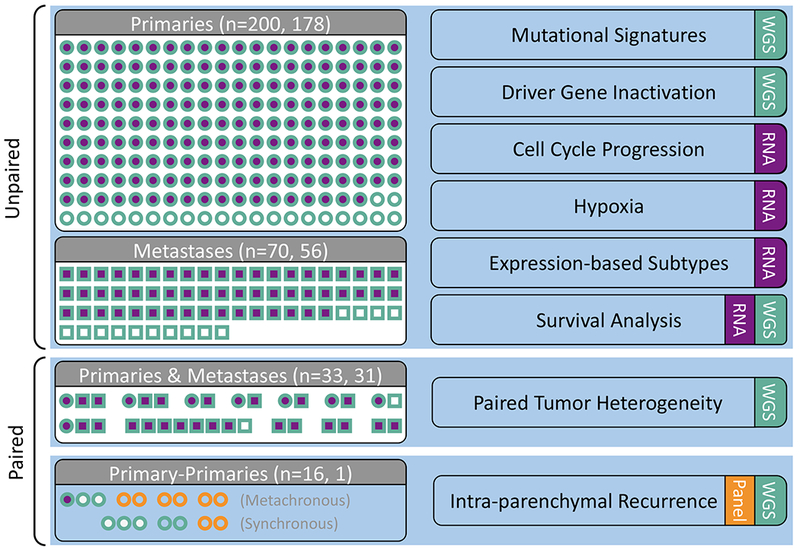
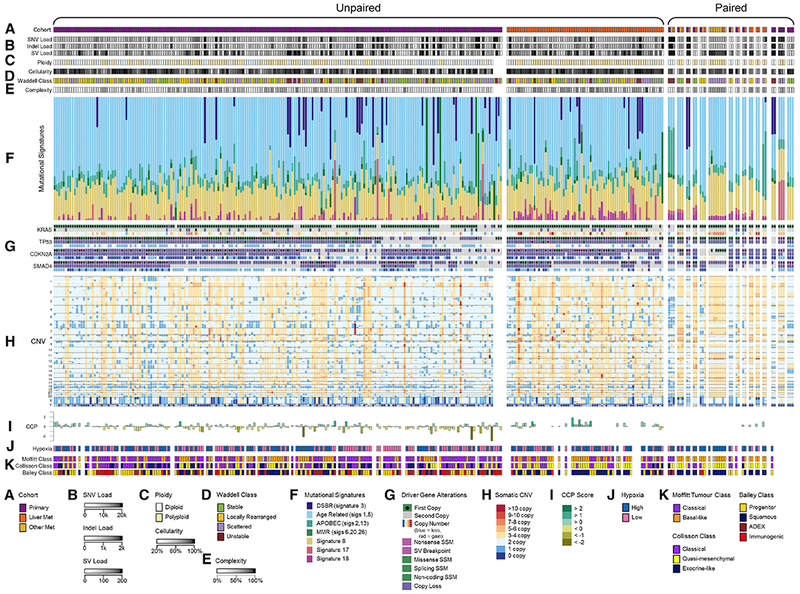
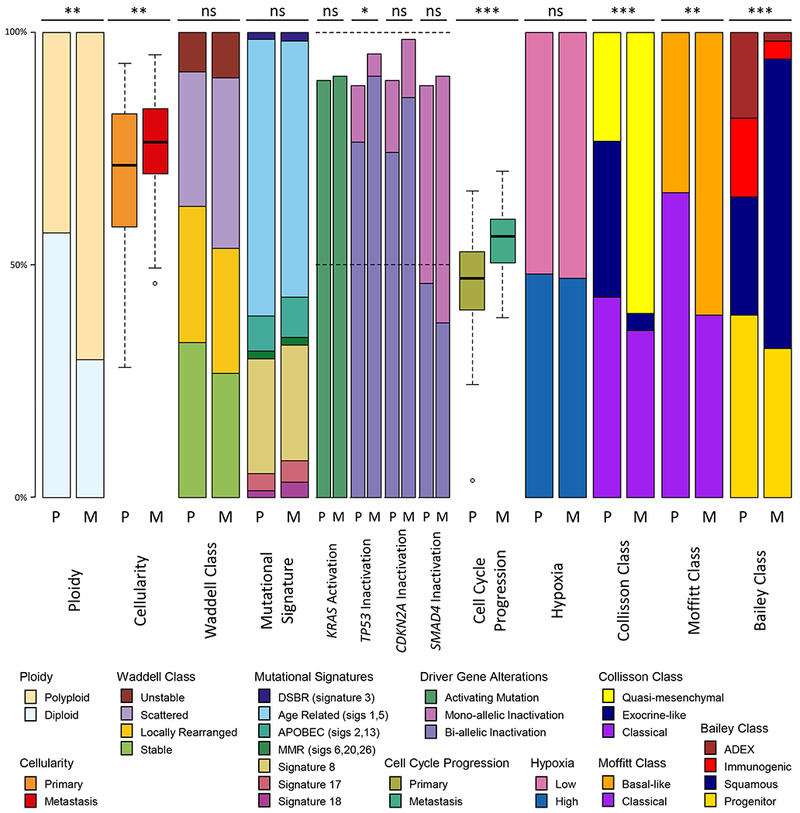
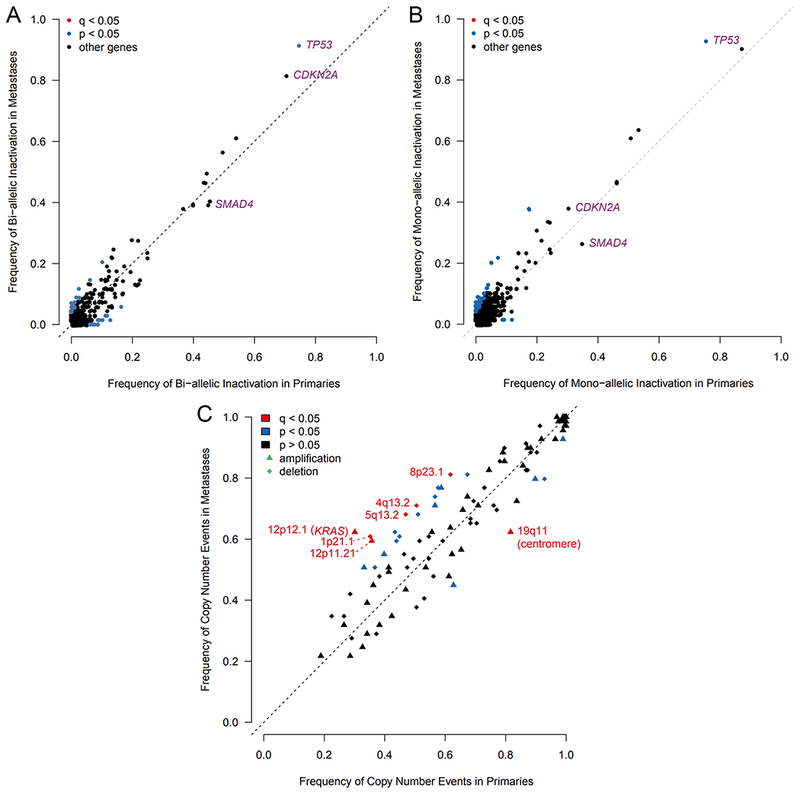
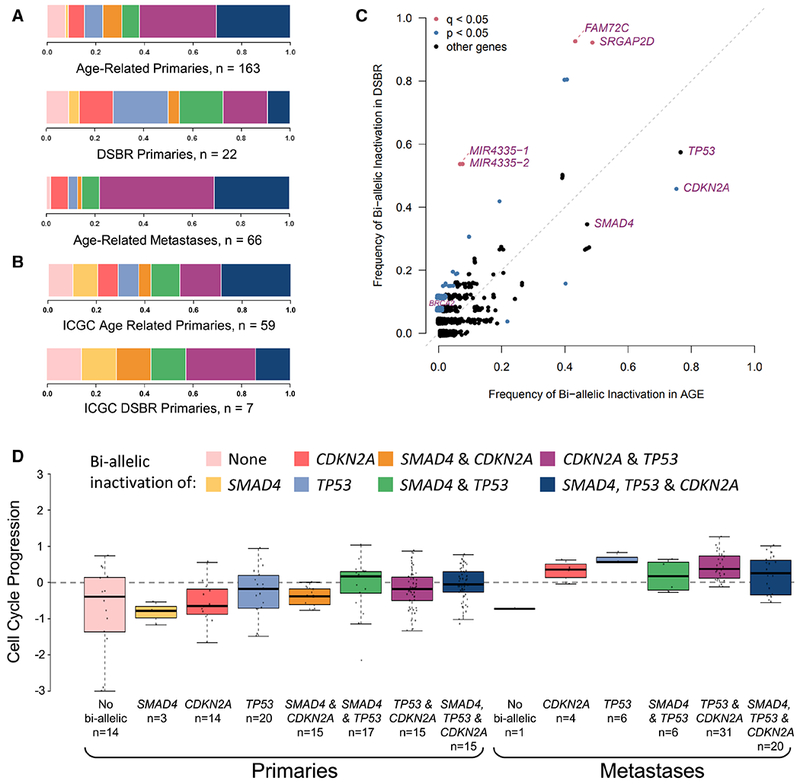
We integrated clinical, genomic, and transcriptomic data from 224 primaries and 95 metastases from 289 patients to characterize progression of pancreatic ductal adenocarcinoma (PDAC). Driver gene alterations and mutational and expression-based signatures were preserved, with truncations, inversions, and translocations most conserved. Cell cycle progression (CCP) increased with sequential inactivation of tumor suppressors, yet remained higher in metastases, perhaps driven by cell cycle regulatory gene variants. Half of the cases were hypoxic by expression markers, overlapping with molecular subtypes. Paired tumor heterogeneity showed cancer cell migration by Halstedian progression. Multiple PDACs arising synchronously and metachronously in the same pancreas were actually intra-parenchymal metastases, not independent primary tumors. Established clinical co-variates dominated survival analyses, although CCP and hypoxia may inform clinical practice.

Keywords: RNA sequencing; cell cycle progression; driver genes; hypoxia; metastases; mutational signatures; pancreatic ductal adenocarcinoma; whole-genome sequencing.


Conflict of interest statement

Declaration of Interests

The authors declare no competing interests.

Figures

Figure 1:
Figure 1:. Cohort description
Primary (circles) and metastatic (squares) samples collected from patients with PDAC. WGS (teal) and RNA-seq (purple) were conducted on samples collected from fresh-frozen (FF) tissue. Targeted sequencing (orange) was performed on either FF or FFPE material (n=4 patients). Analyses are indicated on the right hand side. See also Tables S1 and S2.
Figure 2:
Figure 2:. Mutational signatures and variants in primaries and metastases
(A) Cohorts, (B) Somatic mutational loads, (C) Ploidy and cellularity, (D) Waddell class, (E) Genomic complexity (the proportion of the tumor’s genome with copy number deviating from its ploidy), (F) Mutational signatures, (G) Driver gene alterations, (H) Copy number variation, (I) Cell cycle progression, (J) Hypoxia expression, (K) RNA subtypes. See also Figure S1.
Figure 3:
Figure 3:. Mutational signatures, variants and classes in unpaired primaries and metastases
Proportions of ploidy, cellularity, Waddell class, somatic mutational signatures, driver gene mutation rates, cell cycle progression (CCP), hypoxia, expression-based subtypes between unpaired primary tumors (P) and liver metastases (M). CCP ranges from −3 to 3, all other values range from 0 to 100%. Statistical tests: Wilcoxon rank sum test for cellularity, ploidy and CCP, Likelihood ratio test for somatic mutational signatures, Fisher’s exact test for Waddell class, driver gene alterations, hypoxia, and expression based subtypes. Statistical significance is shown (ns, non-significant, * p<0.05, ** p<0.01, *** p<0.001). Box plots depict the upper and lower quartiles, with the mean shown as a solid line; whiskers indicate the 1.5 times interquartile range (IQR). Data points outside the IQR are shown. See also Figure S4.
Figure 4:
Figure 4:. Frequency of inactivation and copy number changes in primaries and metastases
(A-B) Frequency of bi-allelic (A) and mono-allelic (B) inactivation of all genes, excluding hypermutated tumors. (C) Frequency of recurrent copy number events detected by GISTIC. See also Table S3.
Figure 5:
Figure 5:. Driver gene inactivation, dominant mutational signature and cell cycle progression
(A-B) Combinations of bi-allelic inactivation of SMAD4, CDKN2A and TP53 in age-related primary tumors, DSBR-related primary tumors, and age-related metastases (A) and in age-related and DSBR-related primaries from the ICGC dataset (B). (C) Frequency of bi-allelic inactivation in age-related vs DSBR primaries. (D) CCP in primary and metastatic tumors with different combinations of bi-allelic inactivation. Box plots depict the upper and lower quartiles, with the mean shown as a solid line; whiskers indicate the 1.5 times interquartile range (IQR). Data points outside the IQR are shown. See also Figures S2 and S3.
Figure 6:
Figure 6:. Paired tumoral heterogeneity
(A-B) Heatmap of Jaccard Indices for SNVs and indels (A) and SVs (B) stratified by mutation type. (C) Scatterplot of Jaccard Indices for average simple (y-axis) and structural (x-axis) variation for each tumor pair, colored by age at diagnosis. (D-E) Tumor heterogeneity in PCSI_0378 with Venn diagrams showing shared burden of structural (left) and SNV/indels (right) (D), with inferred phylogeny (E). Note: this case has a strong DSBR signature. See also Figures S6 and S7.
Figure 7:
Figure 7:. Multi-Focal PDAC & Intra-Parenchymal Recurrences Are Metastases
(A and B) Radiologic localization (A) and histologic appearances (B) of primary (head) and intra-parenchymal recurrences (body and tail). (C) Comparison of cancer cell fraction in primary tumor and recurrences. The SMAD4 frameshift mutation is labelled. (D) Venn diagrams showing SVs and SNVs/indels in all three tumors. (E) Inferred phylogeny. See also Figure S8.
Figure 8:
Figure 8:. PDAC outcomes and molecular features
(A-D) Overall (left) and progression free (right) survival in unpaired primaries stratified by TP53 bi-allelic inactivation (A), CDKN2A bi-allelic inactivation (B), hypoxia score (C), or Moffitt expression-based subtyping (D). (E and F) Responses to neoadjuvant chemotherapy, reported as either partial response or stable disease, stratified by hypoxia score (E) or expression-based subtypes (F). See also Tables S4 and S5.

References

    1. AGUIRRE AJ, BARDEESY N, SINHA M, LOPEZ L, TUVESON DA, HORNER J, REDSTON MS & DEPINHO RA 2003. Activated Kras and Ink4a/Arf deficiency cooperate to produce metastatic pancreatic ductal adenocarcinoma. Genes Dev, 17, 3112–26. - PMC - PubMed
    1. AGUIRRE AJ, NOWAK JA, CAMARDA ND, MOFFITT RA, GHAZANI AA, HAZAR-RETHINAM M, RAGHAVAN S, KIM J, BRAIS LK, RAGON D et al., 2018. Real-time Genomic Characterization of Advanced Pancreatic Cancer to Enable Precision Medicine. Cancer Discov, 8, 1096–1111. - PMC - PubMed
    1. ALMOGUERA C, SHIBATA D, FORRESTER K, MARTIN J, ARNHEIM N & PERUCHO M 1988. Most human carcinomas of the exocrine pancreas contain mutant c-K-ras genes. Cell, 53, 549–54. - PubMed
    1. AUNG KL, FISCHER SE, DENROCHE RE, JANG GH, DODD A, CREIGHTON S, SOUTHWOOD B, LIANG SB, CHADWICK D, ZHANG A, et al., 2018. Genomics-Driven Precision Medicine for Advanced Pancreatic Cancer: Early Results from the COMPASS Trial. Clin Cancer Res, 24, 1344–1354. - PMC - PubMed
    1. BAILEY P, CHANG DK, NONES K, JOHNS AL, PATCH AM, GINGRAS MC, MILLER DK, CHRIST AN, BRUXNER TJ, QUINN MC, et al., 2016. Genomic analyses identify molecular subtypes of pancreatic cancer. Nature, 531, 47–52. - PubMed

Publication types

MeSH terms