. 2019 Jan 10:12:1004.
doi: 10.3389/fnins.2018.01004. eCollection 2018.

Correlated MRI and Ultramicroscopy (MR-UM) of Brain Tumors Reveals Vast Heterogeneity of Tumor Infiltration and Neoangiogenesis in Preclinical Models and Human Disease

Affiliations

Correlated MRI and Ultramicroscopy (MR-UM) of Brain Tumors Reveals Vast Heterogeneity of Tumor Infiltration and Neoangiogenesis in Preclinical Models and Human Disease

Michael O Breckwoldt et al. Front Neurosci. .

Abstract

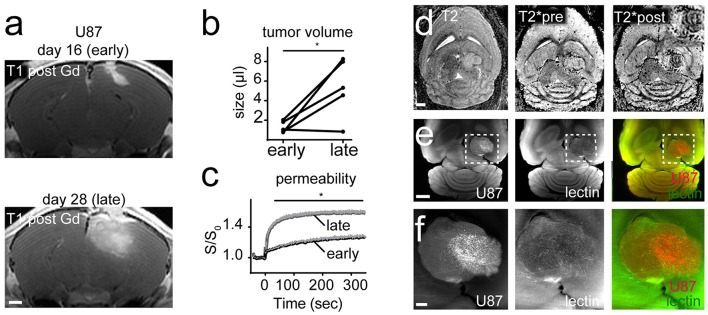
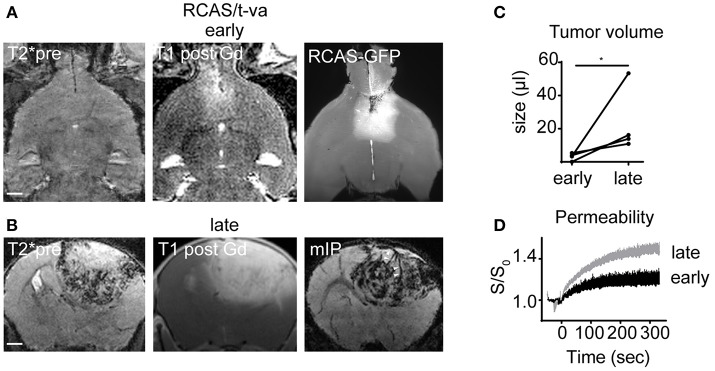
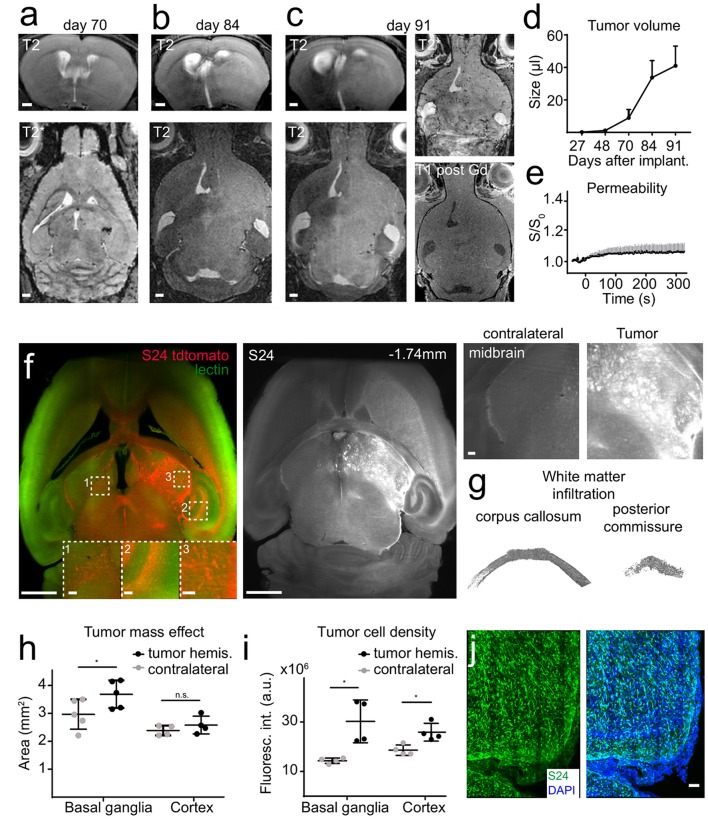
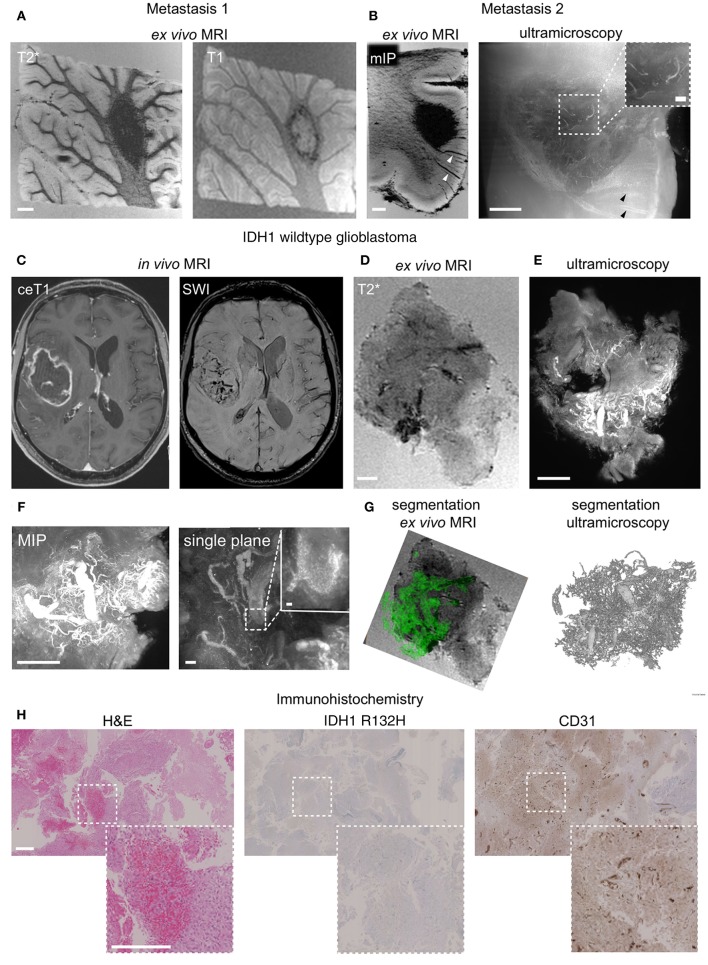
Diffuse tumor infiltration into the adjacent parenchyma is an effective dissemination mechanism of brain tumors. We have previously developed correlated high field magnetic resonance imaging and ultramicroscopy (MR-UM) to study neonangiogenesis in a glioma model. In the present study we used MR-UM to investigate tumor infiltration and neoangiogenesis in a translational approach. We compare infiltration and neoangiogenesis patterns in four brain tumor models and the human disease: whereas the U87MG glioma model resembles brain metastases with an encapsulated growth and extensive neoangiogenesis, S24 experimental gliomas mimic IDH1 wildtype glioblastomas, exhibiting infiltration into the adjacent parenchyma and along white matter tracts to the contralateral hemisphere. MR-UM resolves tumor infiltration and neoangiogenesis longitudinally based on the expression of fluorescent proteins, intravital dyes or endogenous contrasts. Our study demonstrates the huge morphological diversity of brain tumor models regarding their infiltrative and neoangiogenic capacities and further establishes MR-UM as a platform for translational neuroimaging.

Keywords: brain clearing; brain tumor models; glioblastoma; magnetic resonance microscopy; tumor invasion; ultramicroscopy.


Figures

Figure 1
Figure 1
MR-UM of U87MG shows tumor heterogeneity. T1-w images post Gd-contrast application of U87MG tumors 16 days (early) and 28 days (late) after cortical tumor inoculation (n = 5 mice; A). Tumor volume quantification (B). Dynamic contrast enhanced imaging shows vascular permeability over time (C). T2-w, T2* pre and after Gd-contrast application (D). Inset in the upper right corner shows that only the lateral tumor compartment exhibits hypointense tubular vessels. Ultramicroscopy performed after tissue clearing of DS-red labeled U87MG tumor cells and lectin-FITC labeled vessels (E). Magnified images depict two compartments of the bulk tumor (F). Images in (F) are maximum intensity projections. Scale bars are 1 mm in (A,D,E), and 100 μm in (F). *p < 0.05.
Figure 2
Figure 2
MR-UM of RCAS/t-va tumors. Representative T2*, T1 post and ultramicroscopy image at an early tumor stage (n = 4 mice; A). Lower row shows T2*, T1 post and minimum intensity projection (mIP) at a late tumor stage (B). Quantification of tumor volume (C) and dynamic contrast enhanced imaging (D). Arrowheads in mIP indicate tumor vessels. Scale bars in (A,B) are 1 mm. *p < 0.05.
Figure 3
Figure 3
S24 tumors show a diffuse infiltration in the adjacent brain parenchyma. Longitudinal T2w images of S24 tumors at day 70 (A), 84 (B), and 91 (C) after tumor cell implantation into the midbrain (n = 6 mice). S24 tumors do not show intratumoral susceptibility changes nor Gd-contrast enhancement (C). Quantification of tumor size based on T2 hyperintense areas (D) and vascular permeability as assessed by DCE MRI (E). Ultramicroscopy image of S24 tdTomato cells labeled with lectin FITC (F). S24 tumor spread occurs throughout the injected hemisphere and to the contralateral site. Magnified images of the midbrain, hippocampus, and contralateral hemisphere illustrate tumor cell invasion. Segmentation of single S24 tumor cells (depicted in gray) in the corpus callosum and in the posterior commissure (G). Quantification of the total area (H) and fluorescence intensity (I) of the basal ganglia and the cortex illustrates the mass effect and volume increase caused by the tumor. Confocal micrograph (recorded as composite image, tile scan) of an S24 tumor section (J). Scale bars are 1 mm in (A–C), 50 μm in (J) and 1 mm in (F) (100 μm in magnified images). *p < 0.05.
Figure 4
Figure 4
MR-UM of human brain metastasis and glioblastoma. T2* and T1-w images of a human brain metastasis in the cerebellar white matter (A). Depiction of a subcortical metastasis by T2*, shown as minimum intensity projection, mIP to illustrate hypointense tumor draining vessels (arrowhead) and ultramicroscopy (B). In vivo MRI of human glioblastoma (IDH1 wildtype) patient and after specimen resection (C,D). Ultramicroscopy shows the Tortuous tumor vessel network (E). Magnified image shows single, autofluorescent erythrocytes recorded in the red channel as the source of vascular contrast (F). Segmentation of tumor vessels from ex vivo MRI and ultramicroscopy (G). H&E staining of paraffin section, IDH1R132H and CD31 immunohistochemistry (H). MIP: maximum intensity projection. Scale bars are 1 mm in (A–E,H), and 50 μm in (F) (200 μm in inset in B and 10 μm in inset in F).

Similar articles

Cited by

References

    1. Alves S., Bode J., Bemelmans A.-P., von Kalle C., Cartier N., Tews B. (2016). Ultramicroscopy as a novel tool to unravel the tropism of AAV gene therapy vectors in the brain. Sci. Rep. 6:28272. 10.1038/srep28272 - DOI - PMC - PubMed
    1. Birner P., Piribauer M., Fischer I., Gatterbauer B., Marosi C., Ambros P. F., et al. . (2003). Vascular patterns in glioblastoma influence clinical outcome and associate with variable expression of angiogenic proteins: evidence for distinct angiogenic subtypes. Brain Pathol. 13, 133–143. 10.1111/j.1750-3639.2003.tb00013.x - DOI - PMC - PubMed
    1. Breckwoldt M. O., Bode J., Kurz F. T., Hoffmann A., Ochs K., Ott M., et al. . (2016). Correlated magnetic resonance imaging and ultramicroscopy (MR-UM) is a tool kit to assess the dynamics of glioma angiogenesis. Elife 5:e11712. 10.7554/eLife.11712 - DOI - PMC - PubMed
    1. Carmeliet P., Jain R. K. (2011). Molecular mechanisms and clinical applications of angiogenesis. Nature 473, 298–307. 10.1038/nature10144 - DOI - PMC - PubMed
    1. Chen J., McKay R. M., Parada L. F. (2012). Malignant glioma: lessons from genomics, mouse models, and stem cells. Cell 149, 36–47. 10.1016/j.cell.2012.03.009 - DOI - PMC - PubMed