. 2019 Jan 9:12:1013.
doi: 10.3389/fnins.2018.01013. eCollection 2018.

Radiation Induces Distinct Changes in Defined Subpopulations of Neural Stem and Progenitor Cells in the Adult Hippocampus

Affiliations

Radiation Induces Distinct Changes in Defined Subpopulations of Neural Stem and Progenitor Cells in the Adult Hippocampus

Olga A Mineyeva et al. Front Neurosci. .

Abstract

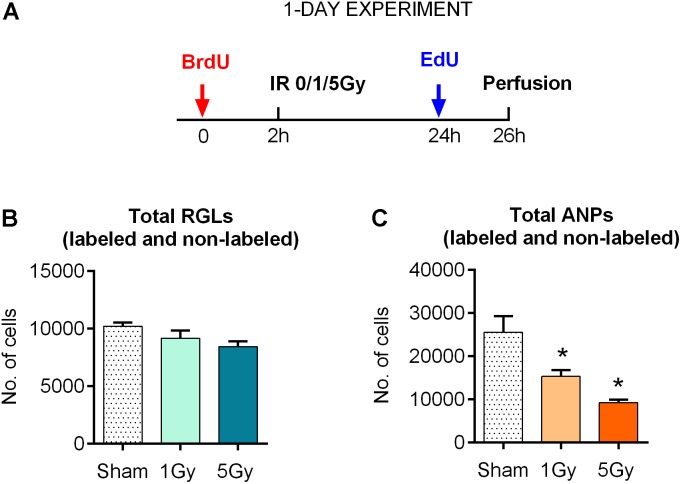
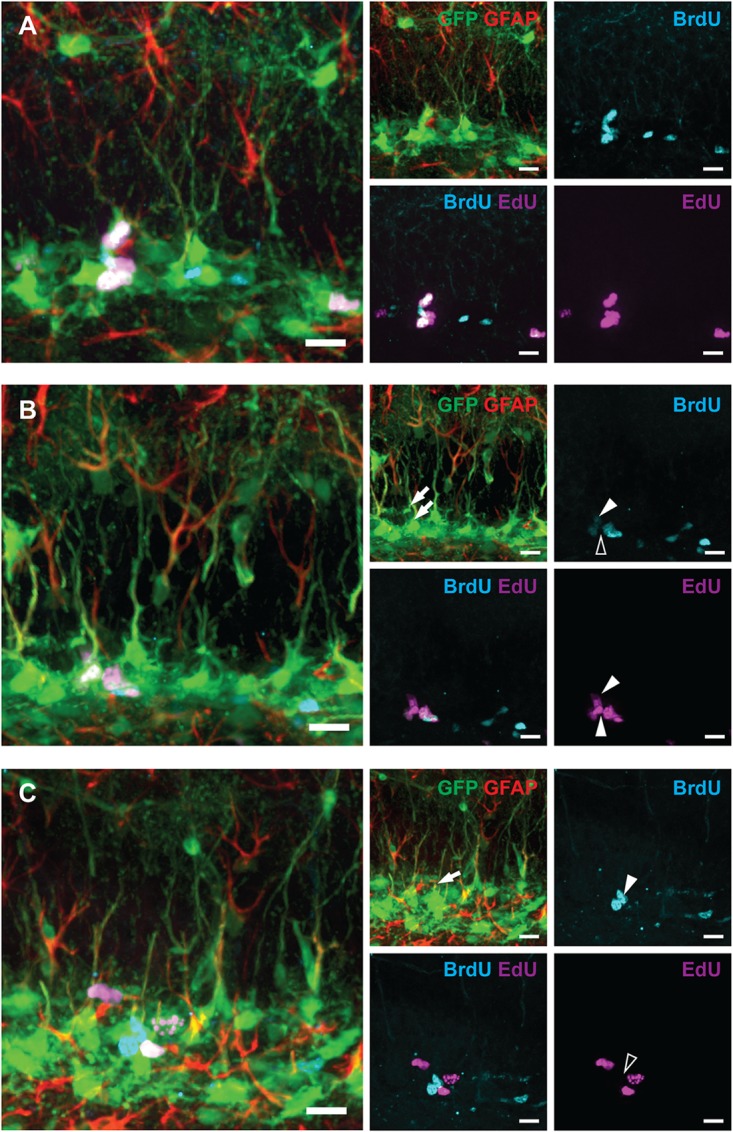
While irradiation can effectively treat brain tumors, this therapy also causes cognitive impairments, some of which may stem from the disruption of hippocampal neurogenesis. To study how radiation affects neurogenesis, we combine phenotyping of subpopulations of hippocampal neural stem and progenitor cells with double- and triple S-phase labeling paradigms. Using this approach, we reveal new features of division, survival, and differentiation of neural stem and progenitor cells after exposure to gamma radiation. We show that dividing neural stem cells, while susceptible to damage induced by gamma rays, are less vulnerable than their rapidly amplifying progeny. We also show that dividing stem and progenitor cells that survive irradiation are suppressed in their ability to replicate 0.5-1 day after the radiation exposure. Suppression of division is also observed for cells that entered the cell cycle after irradiation or were not in the S phase at the time of exposure. Determining the longer term effects of irradiation, we found that 2 months after exposure, radiation-induced suppression of division is partially relieved for both stem and progenitor cells, without evidence for compensatory symmetric divisions as a means to restore the normal level of neurogenesis. By that time, most mature young neurons, born 2-4 weeks after the irradiation, still bear the consequences of radiation exposure, unlike younger neurons undergoing early stages of differentiation without overt signs of deficient maturation. Later, 6 months after an exposure to 5 Gy, cell proliferation and neurogenesis are further impaired, though neural stem cells are still available in the niche, and their pool is preserved. Our results indicate that various subpopulations of stem and progenitor cells in the adult hippocampus have different susceptibility to gamma radiation, and that neurogenesis, even after a temporary restoration, is impaired in the long term after exposure to gamma rays. Our study provides a framework for investigating critical issues of neural stem cell maintenance, aging, interaction with their microenvironment, and post-irradiation therapy.

Keywords: adult neurogenesis; gamma irradiation; nucleotide labeling; quiescent progenitors; stem cells.


Figures

FIGURE 1
FIGURE 1
Response of neural progenitors to gamma radiation (1-day experiment). (A) Experimental design. (B) Response to radiation of radial glia-like neural stem cells (RGLs) 24 h post-exposure to 0, 1, or 5 Gy of gamma rays. (C) Same for amplifying neural progenitors (ANPs). p < 0.05, a comparison with sham group, Dunnett’s multiple comparison test (see Supplementary Table S1 for detailed statistics). Bars show means and standard errors. N = 4 mice were used in 0 Gy group, n = 5 in 1 Gy group, and n = 4 in 5 Gy group.
FIGURE 2
FIGURE 2
Progenitor cell proliferation at 24 h post-exposure to 0, 1, or 5 Gy (1-day experiment—scheme in Figure 1A). (A, B) BrdU+ RGL (A) and ANP (B) cells, representing cells that were in S phase by the time of irradiation (parameter [a]; see text for details). (C, D) EdU+ RGL (C) and ANP (D) cells, representing cells that were in S phase by the time of perfusion (parameter [b]). (E, F) BrdU+ EdU+ double-labeled RGL (E) and ANP (F) cells, representing cells that reentered the cell cycle, i.e., that were in S phase by the time of irradiation and also by the time of perfusion (parameter [c]). (G, H) EdUonly, i.e., BrdUEdU+ RGL (G) and ANP (H) cells, representing cells that were in S phase by the time of perfusion but not by the time of irradiation (parameter [d]). p < 0.05, a comparison with sham group, Dunnett’s multiple comparison test for all cell groups after one-way ANOVA, multiple t-tests with Holm–Sidak multiple comparison method for BrdU+EdU+ cells (see Supplementary Table S1 for detailed statistics). Bars show means and standard errors. N = 4 mice were used in 0 Gy group, n = 5 in 1 Gy group, and n = 4 in 5 Gy group. Examples of cells counted are shown in Figure 3.
FIGURE 3
FIGURE 3
Examples of labeled RGLs and ANPs analyzed in Figure 2 (1-day experiment—scheme in Figure 1A). (A) BrdUonly, EdUonly, and BrdU+EdU+ labeled ANPs. (B) EdUonly labeled RGL [lower arrow on GFAP and GFP channels’ overlay, lower arrowhead (white) in EdU channel, and same position with no labeling shown with blank arrowhead in BrdU channel], BrdU+EdU+ labeled RGL [upper arrow in GFP and GFAP channels’ overlay, upper arrowhead (white) in BrdU channel, and upper arrowhead (white) in EdU channel], other labeled cells represent ANPs. (C) A BrdUonly labeled RGL (arrow in GFAP and GFP channels’ overlay, arrowhead in BrdU channel, and same position with no labeling shown with blank arrowhead in EdU channel), other labeled cells represent ANPs. Scale bars show 20 μm.
FIGURE 4
FIGURE 4
Maintenance of SGZ neural progenitors at 1 day, 2 months, and 6 months post-irradiation with 5 Gy dose. Upper three rows show Nestin-GFP-positive progenitors in the SGZ. Next three rows show dividing cells labeled according to the protocols described in Figures 1A, 5A, 7A. Green color is used for all injected nucleotides. In the fourth row, BrdU+ cells representing cells that were in S phase by the time of irradiation (parameter [a]; see text for details); EdU+ cells representing cells that were in S phase by the time of perfusion (parameter [b]); BrdU+EdU+ double-labeled cells (red arrowheads) representing cells that were in S phase by the time of irradiation and also by the time of perfusion (parameter [c]); EdUonly (i.e., BrdUEdU+) cells (blue arrowheads) representing cells that were in S phase by the time of perfusion but not by the time of irradiation (parameter [d]). Two lower rows represent DCX-positive neurons. Gray dashed line outlines the inner border of SGZ. Scale bars show 100 μm.
FIGURE 5
FIGURE 5
Maintenance of early and late progenitor cells at 2 months post-exposure to 0, 1, or 5 Gy (2-month experiment). (A) Experimental design. (B) Total RGLs (dividing and non-dividing). (C) Dividing (BrdU+) RGLs. (D) Dividing (BrdU+) ANPs. (E) Frequencies of nearest neighbor distances between BrdU-labeled RGLs. The frequencies were estimated as the number of cell pairs at particular distance bins per total number of BrdU+ RGLs. The dots and dotted lines represent mean frequencies and SEM ranges. (F) Survival of cells labeled with EdU at 2 h before the exposure. p < 0.05, a comparison with sham group, Dunnett’s multiple comparison test after one-way ANOVA, multiple t-tests with Holm–Sidak multiple comparison method for EdU+ cells in (F) (see Supplementary Table S2 for detailed statistics). N = 7 mice were used in 0 Gy group, n = 9 in 1 Gy group, and n = 7 in 5 Gy group. Bars show means and standard errors. (G) Examples of a labeled RGL (arrowhead) surrounded by ANPs. Scale bar shows 20 μm.
FIGURE 6
FIGURE 6
Generation of new neurons at 2 months post-exposure to 0 or 5 Gy (2-month experiment – scheme in Figure 5A). (A) Morphological categories of DCX cells. A category cells do not possess processes; B category cells have a short process that is no longer than a cell body; C category cells have a longer dendrite within the granule cell layer; D category cells extend their dendrite into the molecular layer but do not possess branching; E category cells have one branching point; F category cells have more than one branching node in the molecular layer; category G cells branch directly in the granular layer. Upper border of the granule cell layer is schematically shown with a dotted line. The same color scale defining the cell categories is used in (B,D,E). (B) Examples of categorized DCX cells. DCX cells in original images (upper row) classified and colored according to the color scheme in (A) (lower row). Scale bar shows 10 μm. (C) All DCX-positive neurons. p < 0.05, a comparison with sham group, Dunnett’s multiple comparisons after one-way ANOVA. N = 7 mice were used in 0 Gy group, n = 9 in 1 Gy group, and n = 7 in 5 Gy group. (D) Absolute numbers of DCX-positive neurons of each category. p < 0.05, multiple t-tests with Holm–Sidak method (see Supplementary Table S2 for detailed statistics). (E) Fractions of DCX-positive neurons of each cell category. For (D,E), N = 5 mice were randomly selected in each group.
FIGURE 7
FIGURE 7
Maintenance of progenitor cells at 6 months post-exposure to 0 or 5 Gy (6-month experiment). (A) Experimental design. (B) Total RGLs (dividing and non-dividing). (C) Dividing (EdU, IdU, and CldU) RGLs. Right bars correspond to the total number of labeled cells. (D) Dividing (EdU, IdU, and CldU) ANPs. Right bars correspond to the total number of labeled cells. p < 0.05, a comparison with sham group, t-test. See Supplementary Table S3 for detailed statistics. N = 4 mice were used in 0 Gy group and n = 4 in 5 Gy group. Bars show means and standard errors. Examples of labeled cells are shown in Figure 8.
FIGURE 8
FIGURE 8
Examples of labeled cells analyzed in Figure 7 (6-month experiment – scheme in Figure 7A). (A) EdUonly, IdUonly, CldUonly, and EdU+IdU+ labeled ANPs. (B) IdU+EdU+ and CldU+EdU+ labeled ANPs. (C) IdU+EdU+ labeled RGL and ANPs. Scale bar shows 20 μm.

Similar articles

Cited by

References

    1. Abrous D. N., Wojtowicz J. M. (2015). Interaction between neurogenesis and hippocampal memory system: new vistas. Cold Spring Harb. Perspect. Biol. 7:a018952. 10.1101/cshperspect.a018952 - DOI - PMC - PubMed
    1. Achanta P., Fuss M., Martinez J. L., Jr. (2009). Ionizing radiation impairs the formation of trace fear memories and reduces hippocampal neurogenesis. Behav. Neurosci. 123 1036–1045. 10.1037/a0016870 - DOI - PubMed
    1. Acharya M. M., Patel N. H., Craver B. M., Tran K. K., Giedzinski E., Tseng B. P., et al. (2015). Consequences of low dose ionizing radiation exposure on the hippocampal microenvironment. PLoS One 10:e0128316. 10.1016/j.freeradbiomed.2010.08.021 - DOI - PMC - PubMed
    1. Ahles T. A., Root J. C., Ryan E. L. (2012). Cancer- and cancer treatment-associated cognitive change: an update on the state of the science. J. Clin. Oncol. 30 3675–3686. 10.1200/JCO.2012.43.0116 - DOI - PMC - PubMed
    1. Aimone J. B., Li Y., Lee S. W., Clemenson G. D., Deng W., Gage F. H. (2014). Regulation and function of adult neurogenesis: from genes to cognition. Physiol. Rev. 94 991–1026. 10.1152/physrev.00004.2014 - DOI - PMC - PubMed

LinkOut - more resources