. 2019 Jan 9:12:1020.
doi: 10.3389/fnins.2018.01020. eCollection 2018.

Glucose Homeostasis Is Not Affected in a Murine Model of Parkinson's Disease Induced by 6-OHDA

Affiliations

Glucose Homeostasis Is Not Affected in a Murine Model of Parkinson's Disease Induced by 6-OHDA

Felipe Azevedo Gomes et al. Front Neurosci. .

Abstract

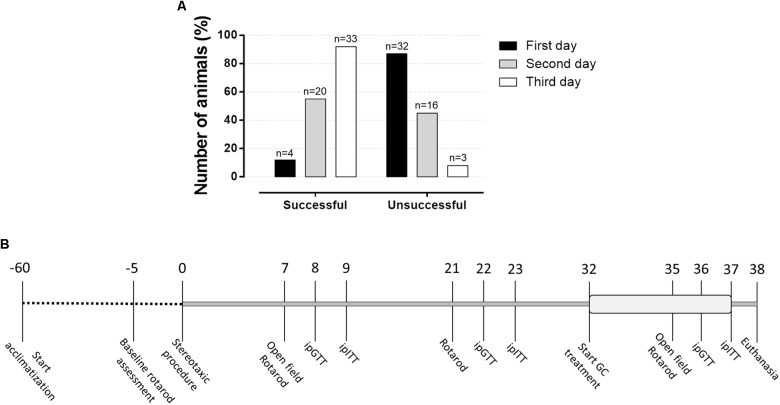
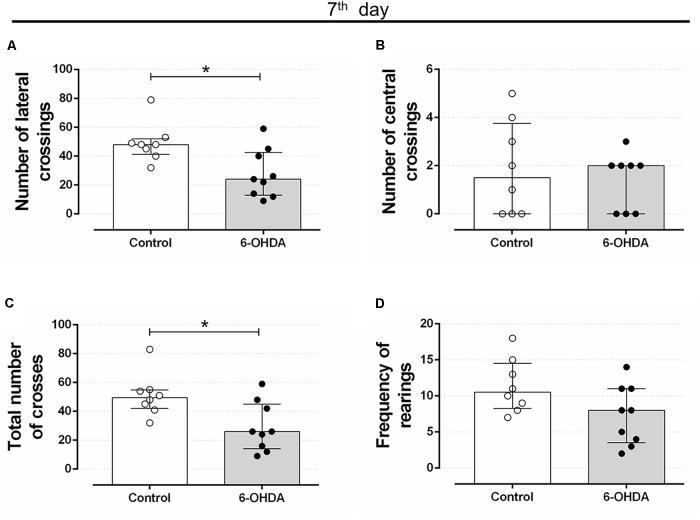
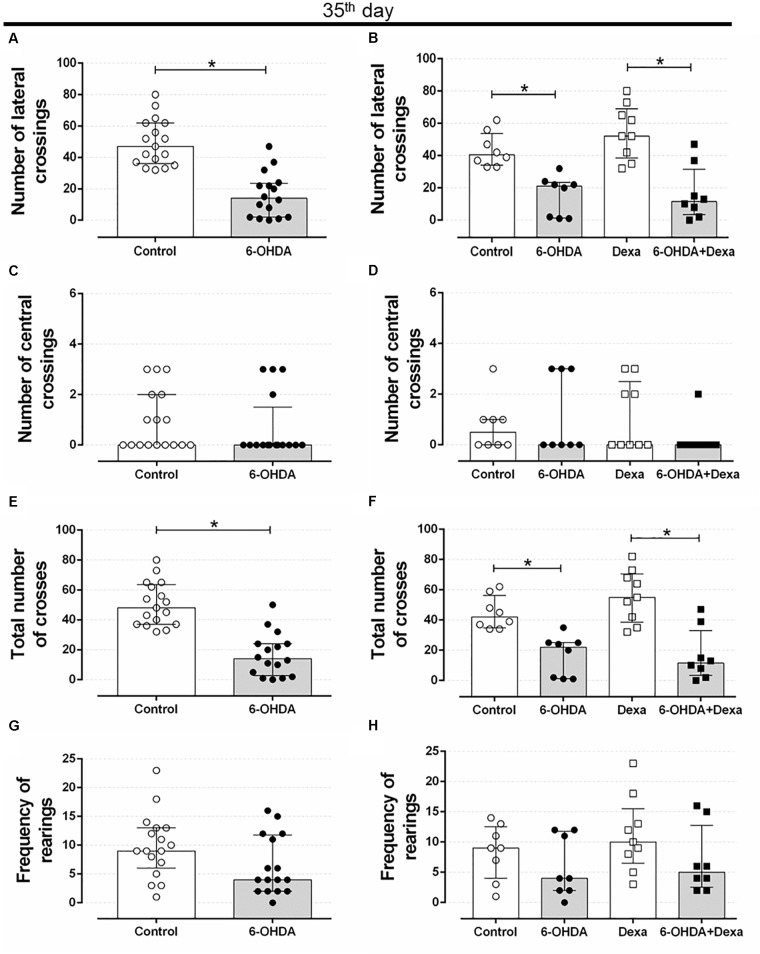
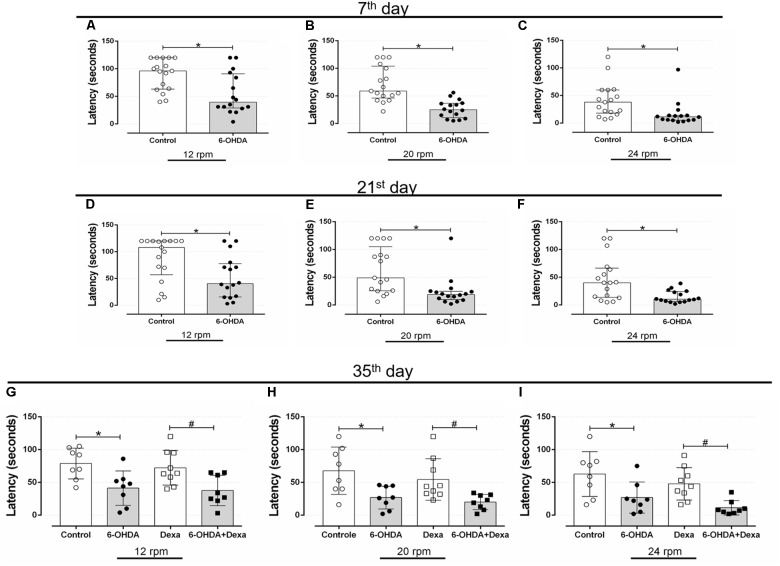
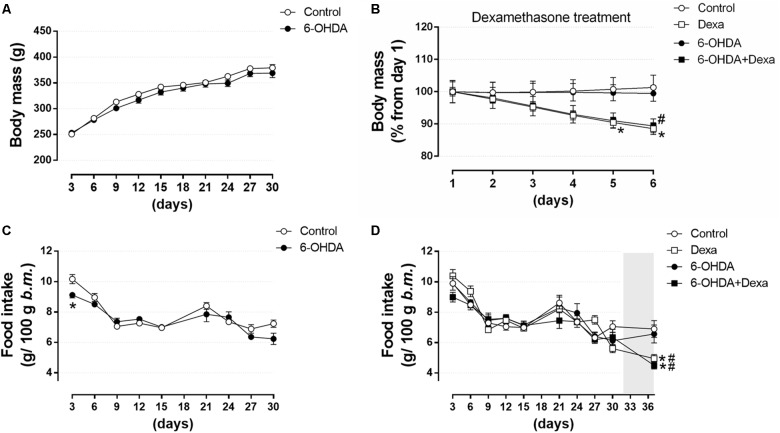
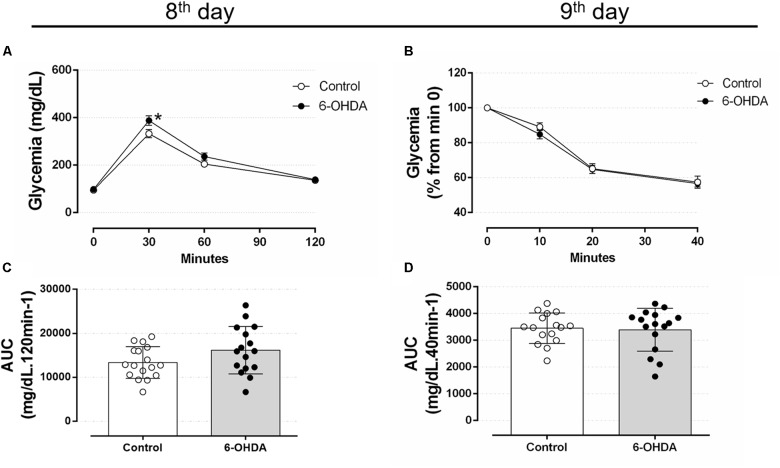
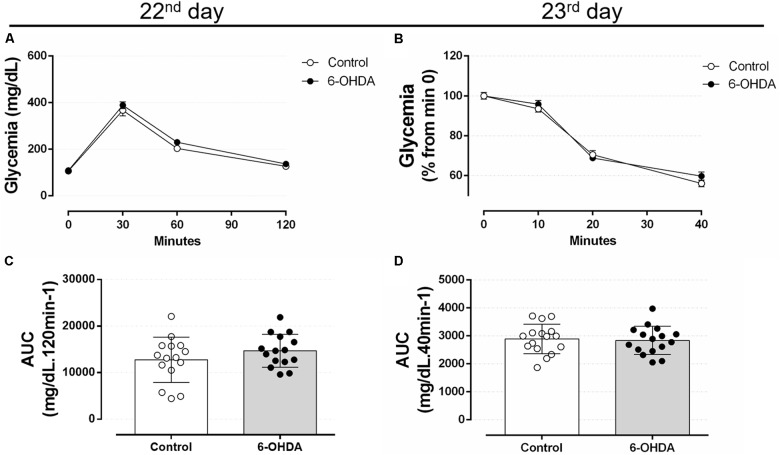
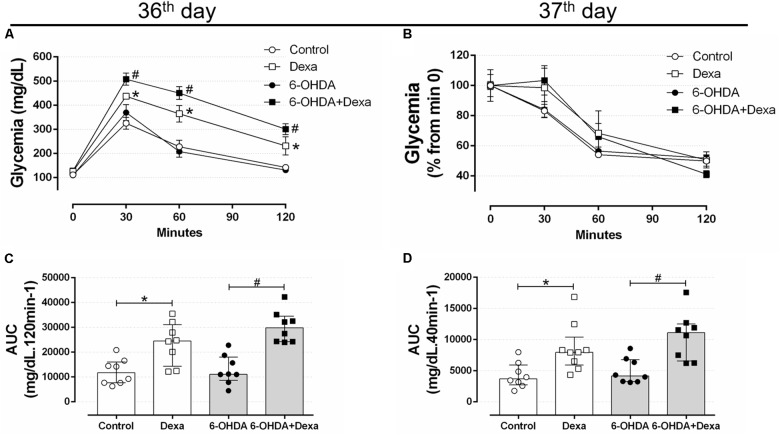
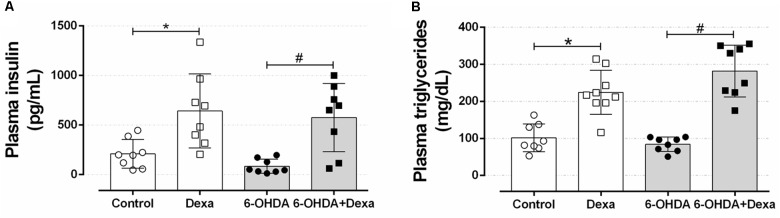
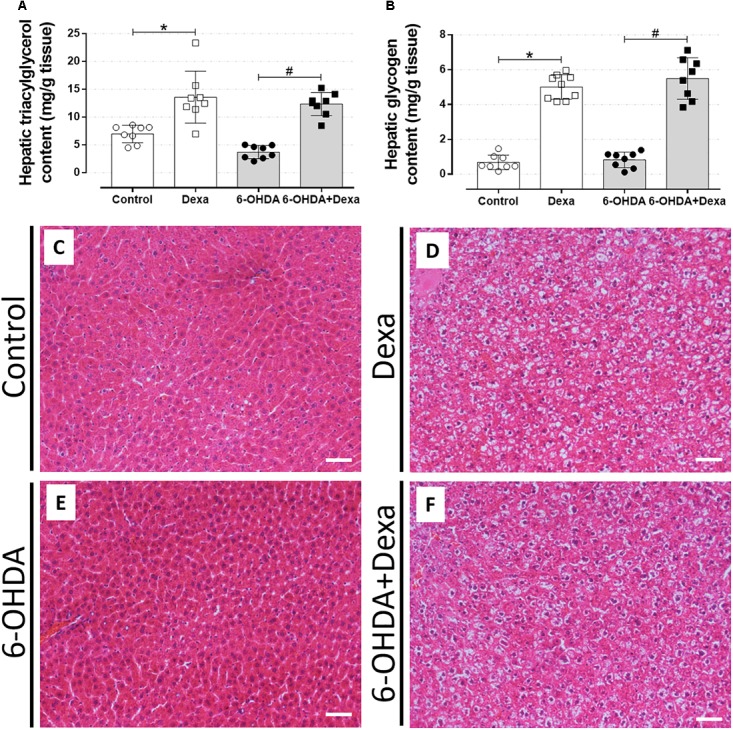
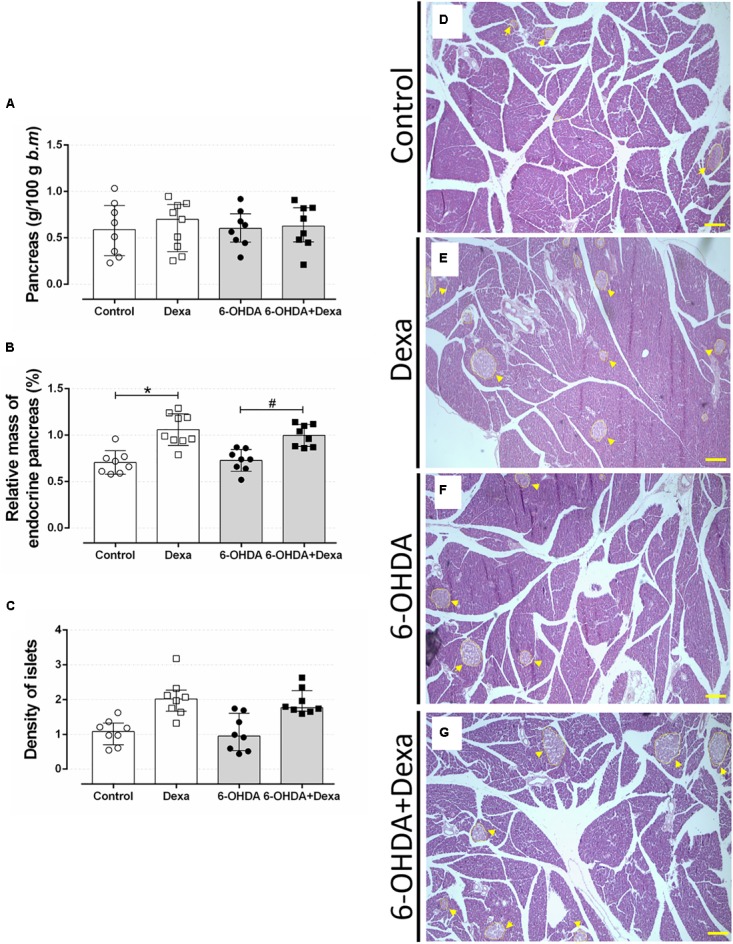
There is a mutual relationship between metabolic and neurodegenerative diseases. However, the causal relationship in this crosstalk is unclear and whether Parkinson's disease (PD) causes a posterior impact on metabolism remains unknown. Considering that, this study aimed to evaluate the appearance of possible changes in metabolic homeostasis due to 6-hydroxydopamine (6-OHDA) administration, a neurotoxin that damage dopaminergic neurons leading to motor impairments that resemble the ones observed in PD. For this, male Wistar rats received bilateral 6-OHDA administration in the dorsolateral striatum, and the motor and metabolic outcomes were assessed at 7, 21, or 35 days post-surgical procedure. Dexamethasone, a diabetogenic glucocorticoid (GC), was intraperitoneally administered in the last 6 days to challenge the metabolism and reveal possible metabolic vulnerabilities caused by 6-OHDA. Controls received only vehicles. The 6-OHDA-treated rats displayed a significant decrease in locomotor activity, exploratory behavior, and motor coordination 7 and 35 days after neurotoxin administration. These motor impairments paralleled with no significant alteration in body mass, food intake, glucose tolerance, insulin sensitivity, and biochemical parameters (plasma insulin, triacylglycerol, and total cholesterol levels) until the end of the experimental protocol on days 35-38 post-6-OHDA administration. Moreover, hepatic glycogen and fat content, as well as the endocrine pancreas mass, were not altered in rats treated with 6-OHDA at the day of euthanasia (38th day after neurotoxin administration). None of the diabetogenic effects caused by dexamethasone were exacerbated in rats previously treated with 6-OHDA. Thus, we conclude that bilateral 6-OHDA administration in the striatum causes motor deficits in rats with no impact on glucose and lipid homeostasis and does not exacerbate the adverse effects caused by excess GC. These observations indicate that neurodegeneration of dopaminergic circuits in the 6-OHDA rats does not affect the metabolic outcomes.

Keywords: Parkinson’s disease; glucocorticoid; glycemia; lipids; liver; pancreatic islets.


Figures

FIGURE 1
FIGURE 1
Percentage of animals responsive to the rotarod basal motor protocol and experimental design. (A) This test was applied before to initiate the surgeries to identify those rats able to follow in the study. Around 12% of the animals responded to the rotarod test in the first attempt, which achieves approximately 91% of success on the third attempt day. (B) The number above line means days along experimental protocol with the respective experimental approaches applied in the study.
FIGURE 2
FIGURE 2
Effect of 6-OHDA on the 7th day of the experimental protocol, in motor parameters evaluated in the open field test. (A) number of lateral crossings; (B) number of central crossings; (C) the total number of crosses (central + lateral); (D) average frequency of rearings. Data are median and interquartile range as they are asymmetrically distributed (nonparametric). Indicates a significant difference compared to the respective control group using unpaired Mann–Whitney. n = 8–9, p < 0.05.
FIGURE 3
FIGURE 3
Effect of 6-OHDA on the 35th day of the experimental protocol, in motor parameters evaluated in the open field test. (A) number of lateral crosses without distinction of dexamethasone treatment; (B) number of lateral crossings; (C) number of central crosses without distinction of dexamethasone treatment; (D) number of central crossings; (E) total number of crosses (central + lateral) without distinction of dexamethasone treatment; (F) total number of crosses (central + lateral); (G) frequency of rearings without distinction of dexamethasone treatment; (H) frequency of rearings. Data are median and interquartile range as they are asymmetrically distributed (nonparametric). Indicates a significant difference compared to the respective control groups using unpaired Mann–Whitney in (A,C,E,G), and Kruskal–Wallis with Dunn’s post hoc test in (B,D,F,H). n = 16–17 in (A,C,E,G), and 8–9 in (B,D,F,H), p < 0.05.
FIGURE 4
FIGURE 4
Effect of 6-OHDA injection, on the 7th, 21st, 35th and day of the experimental protocol, in motor parameter evaluated in the rotarod test d. (A–C) Latency to fall in seconds at speeds of 12, 20, and 24 revolutions per minute (rpm) at the 7th, (D–F) 21st, and (G–I) 35th day. Data are median and interquartile range as they are asymmetrically distributed (non-parametric) in (A–F), and mean ± SD in (G–I). and # Indicates a significant difference compared to the Control and Dexa groups, respectively, using unpaired Mann–Whitney in (A–F), and ordinary two-way ANOVA with Tukey’s post hoc test in (G–I). n = 16–17 in (A–F), and 8–9 in (G–I), p < 0.05.
FIGURE 5
FIGURE 5
Body mass and food intake over 36 days. (A) Body mass of Control and 6-OHDA groups in the first 30 days. (B) Normalized body mass (from the 1st day of treatment) of the Control, Dexa, 6-OHDA and 6-OHDA + Dexa groups during the 6 days of dexamethasone treatment. (C) Food intake of Control and 6-OHDA groups during the first 30 days. (D) Food intake of Control, Dexa, 6-OHDA, and 6-OHDA + Dexa groups during the whole experimental protocol. Data are mean ± SEM (SEM were applied only for aesthetic reasons). and # Indicates a significant difference compared to the Control and 6-OHDA groups, respectively, using unpaired Student’s t-test in (A,C), and ordinary two-way ANOVA with repeated measures in (B,D). n = 16–17 in (A,C), and 8–9 in (B,D), p < 0.05. The light gray color in (D) means the period of dexamethasone treatment (six consecutive days).
FIGURE 6
FIGURE 6
Blood glucose values during the intraperitoneal glucose and insulin tolerance test on the 8th and 9th day of the experimental protocol. (A) Blood glucose values during the ipGTT on the 8th day. (B) Blood glucose values (normalized from min 0) during the ipITT on the 9th day. (C) Area-under-curve during ipGTT and (D) during ipITT. Data are mean ± SEM in (A,B), and mean ± SD in (C,D) (SEM were applied only for aesthetic reasons). Indicates a significant difference compared to the Control using ordinary two-way ANOVA with repeated measures. Unpaired Student’s t-test was applied in (C,D). n = 16–17, p < 0.05.
FIGURE 7
FIGURE 7
Blood glucose values during the intraperitoneal glucose and insulin tolerance test on the 22nd and 23rd day of the experimental protocol. (A) Blood glucose values during the ipGTT on the 22nd day. (B) Blood glucose values (normalized from min 0) during the ipITT on the 23rd day. (C) Area-under-curve during ipGTT and (D) during ipITT. Data are mean ± SEM in (A,B), and mean ± SD in (C,D) (SEM were applied only for aesthetic reasons). Ordinary two-way ANOVA with repeated measures was applied in (A,B), whereas unpaired Student’s t-test was applied in (C,D). n = 16–17, p < 0.05.
FIGURE 8
FIGURE 8
Blood glucose values during the intraperitoneal glucose and insulin tolerance test on the 36th and 37th day of the experimental protocol. (A) Blood glucose values during the ipGTT on the 36th day. (B) Blood glucose values (normalized from min 0) during the ipITT on the 37th day. (C) Area-under-curve during ipGTT and (D) during ipITT. Data are mean ± SEM in (A,B) (SEM were applied only for aesthetic reasons), and median and interquartile range as they are asymmetrically distributed (nonparametric) in (C,D). and # Indicates a significant difference compared to the Control and 6-OHDA groups, respectively, using ordinary two-way ANOVA with repeated measures in (A,B), or Kruskal–Wallis with Dunn’s post hoc test in (C,D). n = 8–9, p < 0.05.
FIGURE 9
FIGURE 9
Circulating parameters. (A) Plasma insulin and (B) triacylglycerol concentration at the day of euthanasia on the 38th day of the experimental protocol. Data are median and interquartile range as they are asymmetrically distributed (nonparametric). and # Indicates a significant difference compared to the respective Control and 6-OHDA groups using Kruskal–Wallis with Dunn’s post hoc test. n = 8–9, p < 0.05.
FIGURE 10
FIGURE 10
Liver parameters. (A) Hepatic triacylglycerol and (B) glycogen content at the day of euthanasia on the 38th day of the experimental protocol. Data are mean ± SD. and # indicate a significant difference compared to the respective Control and 6-OHDA groups using ordinary two-way ANOVA with Tukey’s post hoc test. n = 8–9, p < 0.05. (C–F) Representative liver sections from all groups in 200x magnitude stained with Hematoxylin and Eosin. n = 8–9. Scale bar in (C–F) represents 25 μm.
FIGURE 11
FIGURE 11
Mass of endocrine pancreas. (A) The relative pancreas mass, (B) relative pancreatic islet mass, and (C) the islet density (islet number per 1000 μm2 pancreas section) at the day of euthanasia on the 38th day of the experimental protocol. Data are mean ± SD. and # Indicate a significant difference compared to the respective Control and 6-OHDA groups using ordinary two-way ANOVA with Tukey’s post hoc test. n = 8–9, p < 0.05. (D–G) representative pancreas sections from all groups in 40x magnitude stained with Hematoxylin and Eosin. n = 8–9. Scale bar in (D–G) represents 200 μm. Yellow arrowheads are pointing to pancreatic islets.

Similar articles

Cited by

References

    1. Angelini N., Rafacho A., Boschero A. C., Bosqueiro J. R. (2010). Involvement of the cholinergic pathway in glucocorticoid-induced hyperinsulinemia in rats. Diabetes Res. Clin. Pract. 87 184–191. 10.1016/j.diabres.2009.11.008 - DOI - PubMed
    1. Ashraghi M. R., Pagano G., Polychronis S., Niccolini F., Politis M. (2016). Parkinson’s disease, diabetes and cognitive impairment. Recent. Pat. Endocr. Metab. Immune Drug Discov. 10 11–21. 10.2174/1872214810999160628105549 - DOI - PubMed
    1. Beal M. F. (2005). Mitochondria take center stage in aging and neurodegeneration. Ann. Neurol. 58 495–505. 10.1002/ana.20624 - DOI - PubMed
    1. Becker C., Brobert G. P., Johansson S., Jick S. S., Meier C. R. (2008). Diabetes in patients with idiopathic Parkinson’s disease. Diabetes Care 31 1808–1812. 10.2337/dc08-0479 - DOI - PMC - PubMed
    1. Beyer P. L., Palarino M. Y., Michalek D., Busenbark K., Koller W. C. (1995). Weight change and body composition in patients with Parkinson’s disease. J. Am. Diet. Assoc. 95 979–983. 10.1016/S0002-8223(95)00269-3 - DOI - PubMed