

Dual-Model Radiomic Biomarkers Predict Development of Mild Cognitive Impairment Progression to Alzheimer's Disease
- PMID: 30686995
- PMCID: PMC6338093
- DOI: 10.3389/fnins.2018.01045
Dual-Model Radiomic Biomarkers Predict Development of Mild Cognitive Impairment Progression to Alzheimer's Disease
Abstract
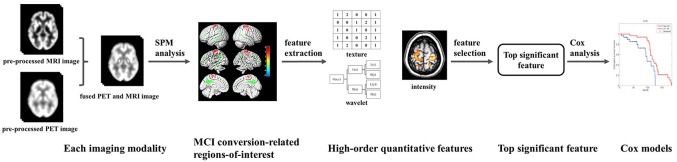
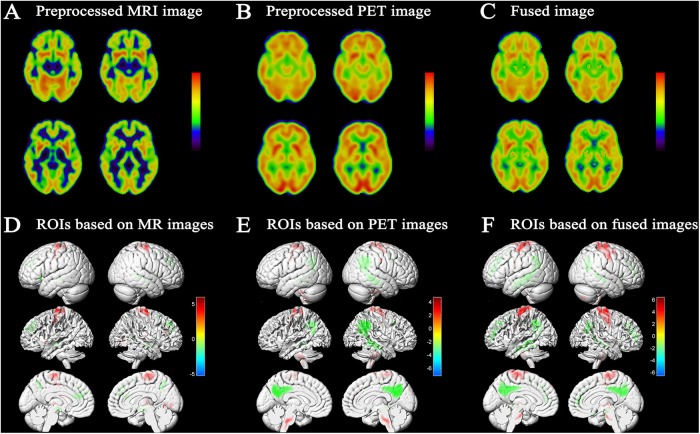
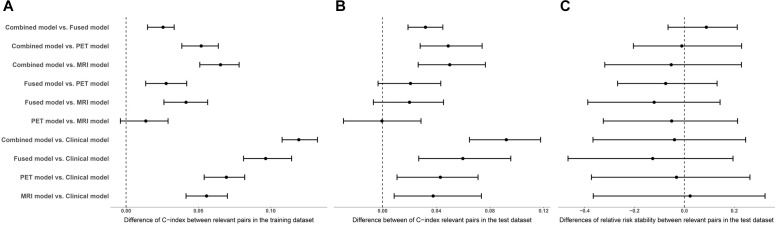
Predicting progression of mild cognitive impairment (MCI) to Alzheimer's disease (AD) is clinically important. In this study, we propose a dual-model radiomic analysis with multivariate Cox proportional hazards regression models to investigate promising risk factors associated with MCI conversion to AD. T1 structural magnetic resonance imaging (MRI) and 18F-Fluorodeoxyglucose (FDG) positron emission tomography (PET) data, from the AD Neuroimaging Initiative database, were collected from 131 patients with MCI who converted to AD within 3 years and 132 patients with MCI without conversion within 3 years. These subjects were randomly partition into 70% training dataset and 30% test dataset with multiple times. We fused MRI and PET images by wavelet method. In a subset of subjects, a group comparison was performed using a two-sample t-test to determine regions of interest (ROIs) associated with MCI conversion. 172 radiomic features from ROIs for each individual were established using a published radiomics tool. Finally, L1-penalized Cox model was constructed and Harrell's C index (C-index) was used to evaluate prediction accuracy of the model. To evaluate the efficacy of our proposed method, we used a same analysis framework to evaluate MRI and PET data separately. We constructed prognostic Cox models with: clinical data, MRI images, PET images, fused MRI/PET images, and clinical variables and fused MRI/PET images in combination. The experimental results showed that captured ROIs significantly associated with conversion to AD, such as gray matter atrophy in the bilateral hippocampus and hypometabolism in the temporoparietal cortex. Imaging model (MRI/PET/fused) provided significant enhancement in prediction of conversion compared to clinical models, especially the fused-modality Cox model. Moreover, the combination of fused-modality imaging and clinical variables resulted in the greatest accuracy of prediction. The average C-index for the clinical/MRI/PET/fused/combined model in the test dataset was 0.69, 0.73, 0.73 and 0.75, and 0.78, respectively. These results suggested that a combination of radiomic analysis and Cox model analyses could be used successfully in survival analysis and may be powerful tools for personalized precision medicine patients with potential to undergo conversion from MCI to AD.
Keywords: Alzheimer’s disease; Cox model; image fusion; mild cognitive impairment; radiomics.
Figures
References
-
- Amadasun M., King R. (1989). Textural features corresponding to textural properties. IEEE Trans. Syst. Man Cybern. 19 1264–1274. 10.1109/21.44046 - DOI
-
- Anandh K., Sujatha C., Ramakrishnan S. (2015). Segmentation and analysis of corpus callosum in Alzheimer MR images using total variation based diffusion filter and level set method. Biomed. Sci. Instrum. 51 355–361. - PubMed
-
- Arbizu J., Prieto E., Martínez-Lage P., Martí-Climent J., García-Granero M., Lamet I., et al. (2013). Automated analysis of FDG PET as a tool for single-subject probabilistic prediction and detection of Alzheimer’s disease dementia. Eur. J. Nucl. Med. Mol. Imaging 40 1394–1405. 10.1007/s00259-013-2458-z - DOI - PubMed