Review
. 2019 Jan 11:12:114.
doi: 10.3389/fnana.2018.00114. eCollection 2018.

Toward a Common Terminology for the Thalamus

Affiliations
Review

Toward a Common Terminology for the Thalamus

Jürgen K Mai et al. Front Neuroanat. .

Abstract

The wealth of competing parcellations with limited cross-correspondence between atlases of the human thalamus raises problems in a time when the usefulness of neuroanatomical methods is increasingly appreciated for modern computational analyses of the brain. An unequivocal nomenclature is, however, compulsory for the understanding of the organization of the thalamus. This situation cannot be improved by renewed discussion but with implementation of neuroinformatics tools. We adopted a new volumetric approach to characterize the significant subdivisions and determined the relationships between the parcellation schemes of nine most influential atlases of the human thalamus. The volumes of each atlas were 3d-reconstructed and spatially registered to the standard MNI/ICBM2009b reference volume of the Human Brain Atlas in the MNI (Montreal Neurological Institute) space (Mai and Majtanik, 2017). This normalization of the individual thalamus shapes allowed for the comparison of the nuclear regions delineated by the different authors. Quantitative cross-comparisons revealed the extent of predictability of territorial borders for 11 area clusters. In case of discordant parcellations we re-analyzed the underlying histological features and the original descriptions. The final scheme of the spatial organization provided the frame for the selected terms for the subdivisions of the human thalamus using on the (modified) terminology of the Federative International Programme for Anatomical Terminology (FIPAT). Waiving of exact individual definition of regional boundaries in favor of the statistical representation within the open MNI platform provides the common and objective (standardized) ground to achieve concordance between results from different sources (microscopy, imaging etc.).

Keywords: MNI standard space; concordance analysis; human; nomenclature; parcellation; terminology; thalamus.


Figures

Figure 1
Figure 1
Individual differences of the thalamus in post-mortem brains (medial is to the left). Each figure shows the cross-section areas and topographies of individual thalamic nuclei in coronal sections at the level of the posterior commissure as presented in the original work of the authors. The section planes are close to perpendicular to the intercommisural line (ICL), the reference line connecting the anterior and posterior commissure, except the slices from Hopf, Feremutsch and Simma, Hirai and Jones, Ding. These are tilted up to 22° to the intercommissural plane. The diagrams were redrawn and color was added. The color in each section designates comparable nuclei or territories (blue: cerebellar territory; green: somatosensory complex; orange: pulvinar; light gray: mediodorsal nucleus; dark gray and black: intralaminar nuclei). For abbreviations see Supplementary Table 5.
Figure 2
Figure 2
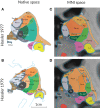
Differences in the structural organization of the thalamus of a “normal” (A,C) and a compromised thalamus (B,D) analyzed by the same author. Parcellation of the thalamus of a 57 year old male without pathologic change in the brain (Hassler, 1977) and of a person with the diagnosis of Parkinson's disease (Hassler et al., 1979). (A,B) Representiation of a coronal section through the posterior commissure as originally published (cf. Figure 1). The scale bar was taken from the original figures; color was added. (C,D) Display of the profiles generated from the 3D reconstruction of the serial sections from both cases. The individual 3D volume was registered into the standard space (using the MNI/ICBM co-registered 3D-AHB model) and a coronal section is presented that passes through the posterior commissure. Color code as in Figure 1. For abbreviations see Supplementary Table 5.
Figure 3
Figure 3
Delineations of the same cell- and fiber-stained sections at mid-thalamic level presented by different specialists. The diagrams were taken from the atlas edited by Dewulf after the Louvain Conference 1963 (publ. 1971) from the following authors: (A), Feremutsch and Simma; (B), Hopf; (C), Macchi; (D), Krieg; (E), Feremutsch and Simma (“standardized nomenclature”). Since all five delineations refer to the same section the V.im region demarcated by Hopf (blue color) was superimposed over the remaining diagrams. The V.im region defined by Hopf (V.im.e, V.im.i, and Z.im.e) is overlapping parts of LDP, LA, LV, and LVP in the diagram of Feremutsch and Simma; it corresponds to the major part of VI but also reaches VOP (Macchi); it is designated as VPL and VV but encroaches also LP, VPI, and Acc (Krieg) and is designated in the “standarized nomenclature” as Vim, VOP and VOM but also includes parts of DP and DA, respectively. Acc, not specified (N. arcuatus); DA, not specified (N. dorsalis anterior); DP, not specified (N. dorsalis posterior); LA, N. lateralis thalami, pars principalis; LDP, N. lateralis thalami, pars dorsalis posterior; LP, N. lateralis posterior; LV, N. lateralis thalami, pars ventralis; LVP, N. lateralis thalami, pars ventralis posterior, V.im.e/i; Ncl. intermedius, pars externa/ interna; VI, Ncl. ventralis intermedius; VOM, not specified (Ncl. ventrolateralis, pars medialis); VOP, Ncl. ventrolateralis, pars posterior; VPI, Ncl. ventralis posterior inferior; VPL, Ncl. ventralis posterior lateralis; VV, N. ventralis ventralis; Z.im,e, Ncl. zentrolateralis intermedius, pars externa.
Figure 4
Figure 4
Sections in three cardinal planes from eight different authors indicating segmentations of the thalamus in the common standard (MNI) space: (A) Hassler (1977), (B) Feremutsch and Simma (1971), (C) Van Buren and Borke (1972), (D) Percheron (2004), (E) Morel (2007), (F) Ilinsky et al. (2018), (G) Ding et al. (2016) and (I) Mai and Majtanik (2017). The exact positions of the three cardinal planes are indicated in the upper line. The color code is the same as in the preceding figures. Right side: areas or nuclei that have been selected for the clusters representing the nigral, pallidal (yellow), cerebellar (blue), sensory (green) territories, and the anterior thalamic nucleus. For abbreviations see Supplementary Table 2.
Figure 5
Figure 5
Coronal sections through the thalamus of a fetal human brain at 17 weeks of pregnancy. The immunoreactivity against the cell-surface epitope CD15 (left) and calbindin (right) shows the main thalamic nuclei separated by the intralaminar formation that is CD15 negativ (red arrows) except the associated nuclei (Ncl. centrum medianum CM and Ncl. centralis lateralis, blue arrows) but calbindin positive. Scale bar 1 mm. HB, habenula; Pf, parafascicular nucleus; PV, periventricular region; VP, ventroposterior complex.
Figure 6
Figure 6
Representation of the intralaminar formation (IL) in relation to the mediodorsal nucleus (MD) and the anterior commissure (ac) and the inferior thalamic peduncle (ithp) as orientation marks. (a) MD is sliced to show the anterior, middle and posterior divisions of IL separately. The core of the formation is represented by the portion nestling around the lateral perimeter of the MD and separating the medial from the lateral region of the thalamus. This central portion bifurcates anterodorsally (asterisk) to form the shell below the anterodorsal region. Ventrally the internal lamina also bifurcates (double asterisk) to form a cap that bounds the centromedian nucleus (CM) and then continues around the anterior pole of MD. Cells within the branching areas are the central lateral nucleus (asterisk) and the paracentral nucleus (double asterisk). At the anterior and posterior pole of the MD the internal medullary lamina enlarges and differentiates as central medial nucleus (CeM) anteriorly and as suprageniculate and limitans nuclei (Lim/SG), respectively. (b) Medial view of a reconstruction of the IL (red). The IL extends along the ventral surface of MD, represented by the central medial nucleus (CeM), parafascicular nucleus (Pf) and Lim/SG. 1–5: divisions of the IL; 1, superior part; 2. central (lateral) part; 3, circumcentral part (lamella intermedia, Schnopfhagen, 1877; lamella praesemilunaris; Hassler, 1982); 4, anterior part; 5, posterior part (retrocentral part); Cuc, cucullar nucleus.
Figure 7
Figure 7
Horizontal calbindin-stained sections through the middle of the mediodorsal nucleus at 19 weeks of gestation (a) and at adulthood (b). Within the lateral nuclei calbindin-immunoreactivity is observed exclusively in the pallidal territory (VAL).
Figure 8
Figure 8
Lateral (LGN) and medial (MGN) geniculate nuclei at 15 weeks of gestation (CD15 immunoreactivity) (from Mai et al., ; with permission). (a) The continuity of the future MGN with the ventroposterior complex (VC) is apparent. (b) Higher magnification shows that the curled, wavy or band like disposition of CD15 immunoreactivity in the ventral parvosellular subnucleus (arrowheads in area surrounded by dashed line) which might correspond to the tonotopically organized fibrodendritic laminae. Arrows indicate regions extending into VC. Scale bars 5 mm in a and 100 μm in (b).
Figure 9
Figure 9
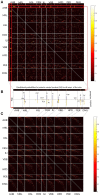
Local area level concordance analysis of the nine atlases shown as image representing the non-symmetric concordance matrix P. (A) Each pixel in the image specifies the Pij value by its color. The Pij value expresses the probability of a voxel for being in area i in one atlas given that it is in area j in other atlas. Each row and column represent one specific area in an atlas. Areas belonging to an atlas are grouped together and the borders between the atlases are denoted by white lines inducing the appearance of the rectangular blocks in the image. (B) Here we show for the anterior ventral nucleus (AV) area from Atlas of the Human Brain how the values in the matrix should be interpreted. The row and column in the matrix that correspond to the AV values (red zoomed rectangles) are displayed as the bars. The color of the pixels in the row and the column (from yellow to red) determines the height of the bars in the plot (see the color bar on the right). The blue bars specify the proportion of AV comprised in other regions, and the yellow bars (below) indicate the proportion of other regions comprised in the AV region. The labels above the bars correspond to the significantly overlapping regions from the other atlases. (C) The matrix is shown after modifying the order of the areas independently within each block. The non-zero Pij values form a pixel cloud centered around the diagonal of the block. The brightness of this cloud shows the level of correspondence between the atlases and the width of the cloud approximates the frequency of the subdivision configurations between the atlases.
Figure 10
Figure 10
Visualization of inter-atlas relationships using multi-dimensional scaling. The atlases are shown in a 2-D landscape computed from distances derived from the Wmax and Wasym values (Tables 2B,c). Atlases that can mutually be better predicted from each other and share similar asymmetry values reside closer in this space. The two recognizable clusters are indicated by red and blue dashed ellipsoids. The arbitrary dimensions one and two give coordinates for the projected atlas similarity values in the 2D space.
Figure 11
Figure 11
Visualization of Wmax (top row) and Wasym (bottom row) in 3D space. The regions with high concordances and asymmetry (MD, AV) can directly be identified in the slices as areas with strong red color. The ellipsoid and arrows point to the region with the lowest concordances: lateral ventroanterior nucleus (VAL) and intralaminar formation (IL).
Figure 12
Figure 12
Active deep brain stimulation (DBS) sites in tremor patients from two studies (Hamel et al., ; Fiechter et al., 2017) attributed to the VIM region. (A) Positions of the DBS stimulation sites in the MNI space. The coordinates of the DBS target in MNI space for Fiechter et al. (yellow) x = 14.3 mm, y = −17.40 mm, z = −2.17 mm and for Hammel et al. (red) y = 12.7 mm, y = −19.6 mm, z = −4.38 mm. (B) Anatomical characterization of the targets (Table 2D) presented in an analysis tool. Such anatomical characterization is available for each voxel in thalamus.

Similar articles

Cited by

References

    1. Albe-Fessard D., Guiot G., Lamarre Y., Arfel G. (1966). Activation of thalamocortical projections related to tremorogenic processes, in The Thalamus, eds Purpura D. P., Yahr M. D. (New York, NY: Columbia University Press; ), 237–253.
    1. Altman J., Bayer S. A. (1988). Development of the rat thalamus: I. Mosaic organization of the thalamic neuroepithelium. J. Comp. Neurol. 275, 346–377. 10.1002/cne.902750304 - DOI - PubMed
    1. Amunts K., Morosan P., Hilbig H., Zilles K. (2012). Auditory system, in The Human Nervous System, 3rd Edn, eds Mai J. K., Paxinos G. (San Diego, CA: Academic Press/Elsevier; ), 1270–1300. 10.1016/B978-0-12-374236-0.10036-7 - DOI
    1. Andrew J., Watkins E. S. (1969). A Stereotaxic Atlas of the Human Thalamus and Adjacent Structures: A Variability Study. Philadelphia, PA: Lippincott Williams & Wilkins.
    1. Anthoney T. R. (1994). Neuroanatomy and the Neurologic Exam: A Thesaurus of Synonyms, Similar Sounding Non-Synonyms and Terms of Variable Meaning. Boca Raton, FL: CRC Press.

LinkOut - more resources