Review
. 2019 Jan 9:12:521.
doi: 10.3389/fnhum.2018.00521. eCollection 2018.

EEG Frequency Bands in Psychiatric Disorders: A Review of Resting State Studies

Affiliations
Review

EEG Frequency Bands in Psychiatric Disorders: A Review of Resting State Studies

Jennifer J Newson et al. Front Hum Neurosci. .

Abstract

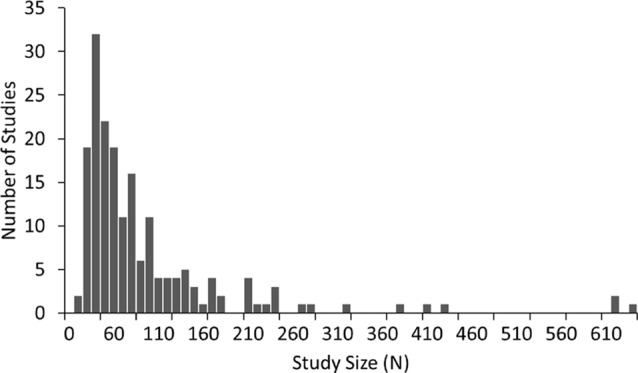
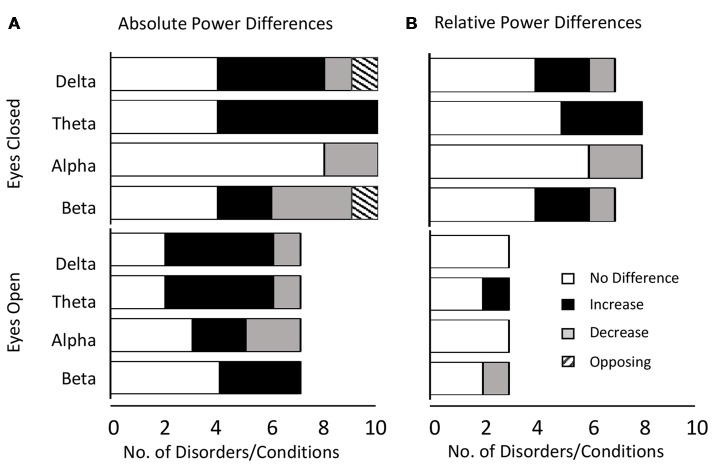
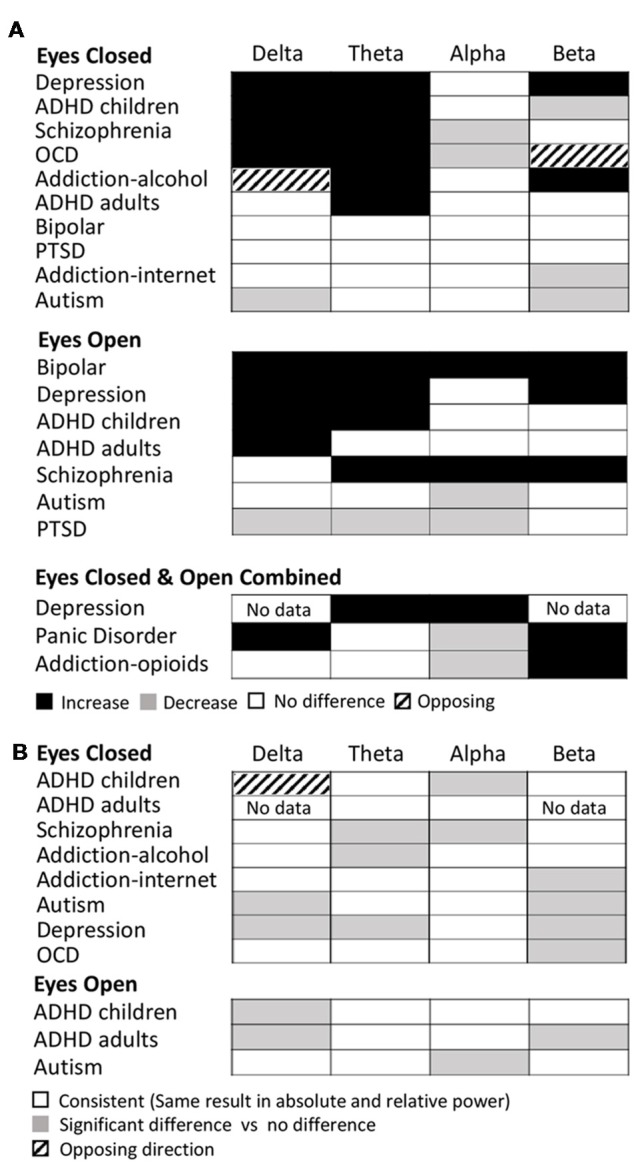
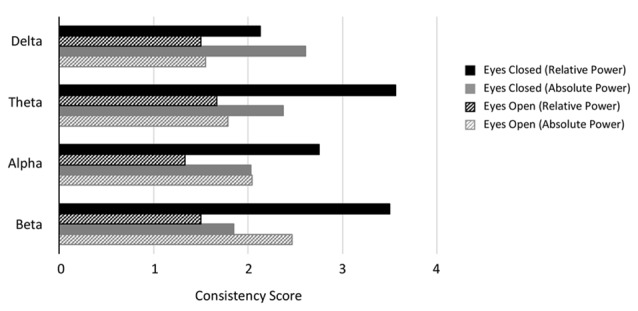
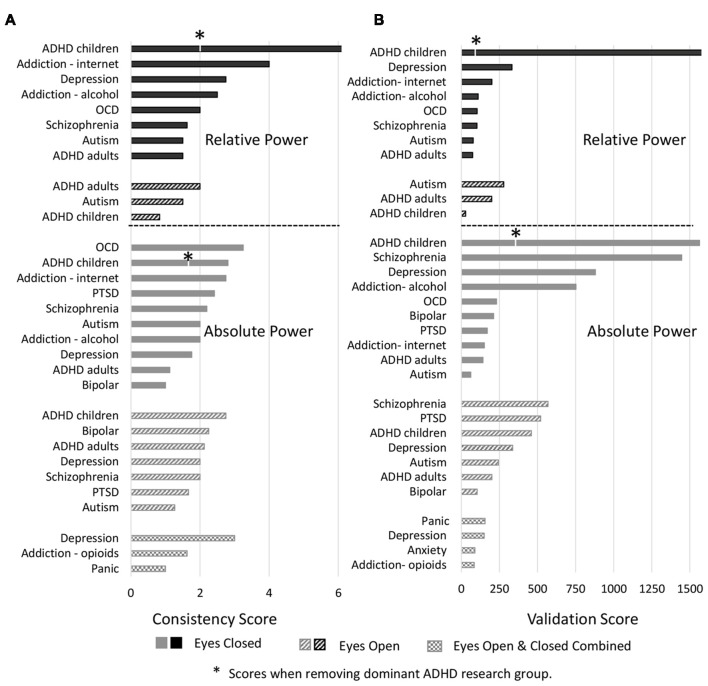
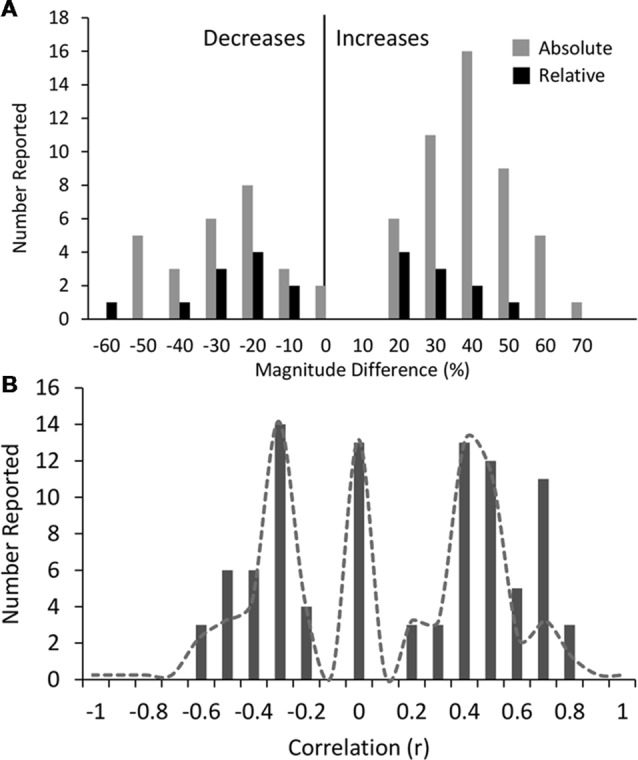
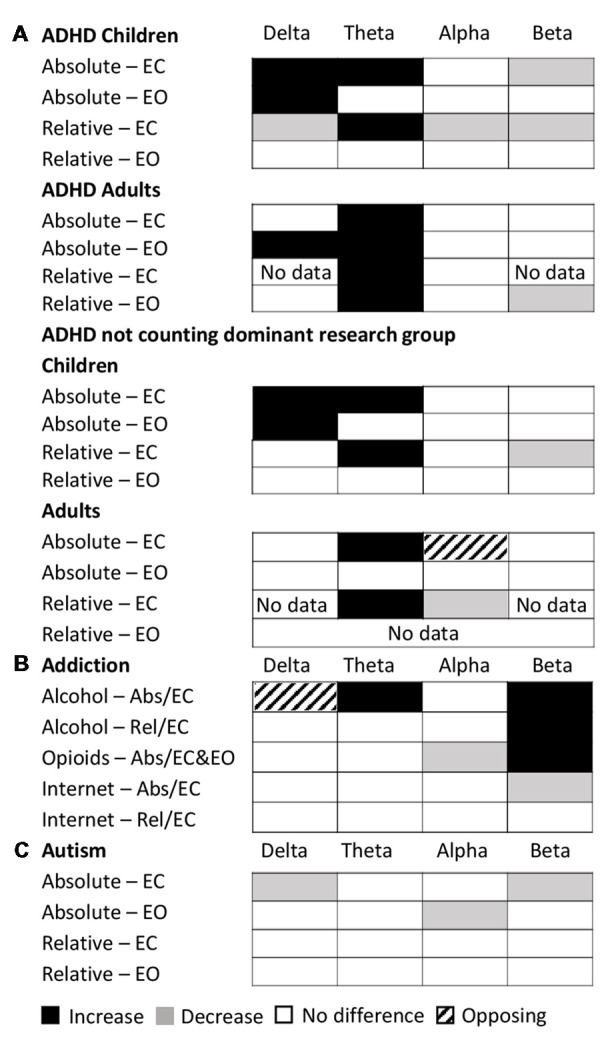
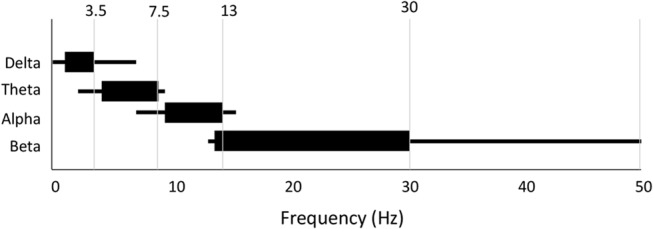
A significant proportion of the electroencephalography (EEG) literature focuses on differences in historically pre-defined frequency bands in the power spectrum that are typically referred to as alpha, beta, gamma, theta and delta waves. Here, we review 184 EEG studies that report differences in frequency bands in the resting state condition (eyes open and closed) across a spectrum of psychiatric disorders including depression, attention deficit-hyperactivity disorder (ADHD), autism, addiction, bipolar disorder, anxiety, panic disorder, post-traumatic stress disorder (PTSD), obsessive compulsive disorder (OCD) and schizophrenia to determine patterns across disorders. Aggregating across all reported results we demonstrate that characteristic patterns of power change within specific frequency bands are not necessarily unique to any one disorder but show substantial overlap across disorders as well as variability within disorders. In particular, we show that the most dominant pattern of change, across several disorder types including ADHD, schizophrenia and OCD, is power increases across lower frequencies (delta and theta) and decreases across higher frequencies (alpha, beta and gamma). However, a considerable number of disorders, such as PTSD, addiction and autism show no dominant trend for spectral change in any direction. We report consistency and validation scores across the disorders and conditions showing that the dominant result across all disorders is typically only 2.2 times as likely to occur in the literature as alternate results, and typically with less than 250 study participants when summed across all studies reporting this result. Furthermore, the magnitudes of the results were infrequently reported and were typically small at between 20% and 30% and correlated weakly with symptom severity scores. Finally, we discuss the many methodological challenges and limitations relating to such frequency band analysis across the literature. These results caution any interpretation of results from studies that consider only one disorder in isolation, and for the overall potential of this approach for delivering valuable insights in the field of mental health.

Keywords: ADHD; EEG; depression; electroencephalography; power spectrum; psychiatric; resting-state; schizophrenia.


Figures

Figure 1
Figure 1
Distribution of sample size across 184 studies in this review. Sample size includes both patients and controls. Median sample size was 60. One study, with a sample size of 1,344, was beyond the scale of this graph.
Figure 2
Figure 2
Dominant result aggregated across all disorders and bands. (A) Number of disorders with no difference in absolute power relative to controls (white), an increase (black), a decrease (gray) or opposing results (hashed) for eyes closed (top) and eyes open (bottom) conditions. Increases are more common for lower frequency bands (delta and theta) whilst decreases or no significant difference are more common for higher frequency bands (alpha and beta). (B) Same as (A) for relative power. Legends and axis labels are common.
Figure 3
Figure 3
Dominant results for each individual disorder and band. (A) Differences in absolute power for each disorder (relative to control) for eyes closed condition (top), eyes open (middle) and eyes open and closed combined (bottom). White boxes indicate no change, black indicates an increase, and gray indicates a decrease. Opposing results are shown by hashed boxes. (B) Difference in results between absolute power and relative power for the same disorders. White indicates no difference, gray indicates a significant increase or decrease in one but no significant difference in the other, while a hashed box indicates opposite results.
Figure 4
Figure 4
Consistency scores aggregated across disorders for each band and condition. Consistency scores (frequency of dominant result relative to other results) were between 2 and 3 for absolute power in the eyes closed condition for all bands (gray bars), between 2 and 4 for relative power eyes closed (black bars) and typically between 1 and 2 for eyes open (absolute and relative, gray and black hashed bars, except beta eyes open absolute power).
Figure 5
Figure 5
Consistency and validation scores by disorders. (A) Consistency scores for each disorder for relative power (top) with eyes closed (black bars) and eyes open (black hashed bars) and absolute power (bottom) with eyes closed (gray bars), eyes open (gray hashed bars) and eyes closed and open combined (hatched bars). Asterisk marks for attention deficit-hyperactivity disorder (ADHD) indicate consistency scores when the dominant research group is excluded. (B) Validation scores for each disorder. Order and legend are as in (A). Validation score for ADHD in children, relative power with eyes closed goes beyond the scale of this graph (2,516).
Figure 6
Figure 6
Histograms of magnitudes of differences and correlations. (A) All reported magnitudes for differences between disorder groups and controls across all bands for absolute (gray bars) and relative power (black bars). Increases are shown as positive and decreases are negative. Reported increases for absolute power outnumbered reported decreases, although were similar in magnitude (35% and 34% respectively). Relative power was relatively symmetric with average magnitude increases of 22% and decreases of 31%. (B) Histogram of all reported correlations of band increases or decreases with symptom severity scores (all results were included even if not the dominant result). Reports of “no significant correlation” are shown as 0. Positive and negative correlations were typically between 0.2 and 0.5 although positive correlations were higher on average. High correlations (>0.6) were only found in two small studies (N < 40). Dotted line shows histogram excluding these two studies.
Figure 7
Figure 7
Dominant results across conditions for specific disorders. (A) Dominant result for each band for ADHD for each of various conditions and age groups for both relative (rel) and absolute (abs) power and for eyes closed (EC) and eyes open (EO), including all studies (top) and excluding the dominant research group (bottom). White boxes indicate no change, black indicates an increase, and gray indicates a decrease. Opposing results are shown by hashed boxes. (B) Dominant result for each band for each type of addiction and condition. Legend as in (A). (C) Dominant result for each band for autism for each condition. Legend as in (A).
Figure 8
Figure 8
Variability in frequency band definition. Range of frequencies used for each band across all 184 studies. Thick line indicates most commonly used range.

Similar articles

Cited by

References

    1. Abramovitch A., Dar R., Mittelman A., Wilhelm S. (2015). Comorbidity between attention deficit/hyperactivity disorder and obsessive-compulsive disorder across the lifespan: a systematic and critical review. Harv. Rev. Psychiatry 23, 245–262. 10.1097/HRP.0000000000000050 - DOI - PMC - PubMed
    1. Achenbach T. M., Rescorla L. A. (2001). Manual for the ASEBA School-Age Forms and Profiles: An Integrated System of Mult-Informant Assessment. Burlington: University of Vermont, Research Center for Children, Youth and Families.
    1. Acunzo D. J., MacKenzie G., van Rossum M. C. W. (2012). Systematic biases in early ERP and ERF components as a result of high-pass filtering. J. Neurosci. Methods 209, 212–218. 10.1016/j.jneumeth.2012.06.011 - DOI - PubMed
    1. Andreou C., Nolte G., Leicht G., Polomac N., Hanganu-Opatz I. L., Lambert M., et al. . (2015). Increased resting-state Gamma-band connectivity in first-episode schizophrenia. Schizophr. Bull. 41, 930–939. 10.1093/schbul/sbu121 - DOI - PMC - PubMed
    1. Andrew C., Fein G. (2010). Induced theta oscillations as biomarkers for alcoholism. Clin. Neurophysiol. 121, 350–358. 10.1016/j.clinph.2009.11.080 - DOI - PMC - PubMed