

Metabolite Profile of Alzheimer's Disease in the Frontal Cortex as Analyzed by HRMAS 1H NMR
- PMID: 30687076
- PMCID: PMC6333733
- DOI: 10.3389/fnagi.2018.00424
Metabolite Profile of Alzheimer's Disease in the Frontal Cortex as Analyzed by HRMAS 1H NMR
Abstract
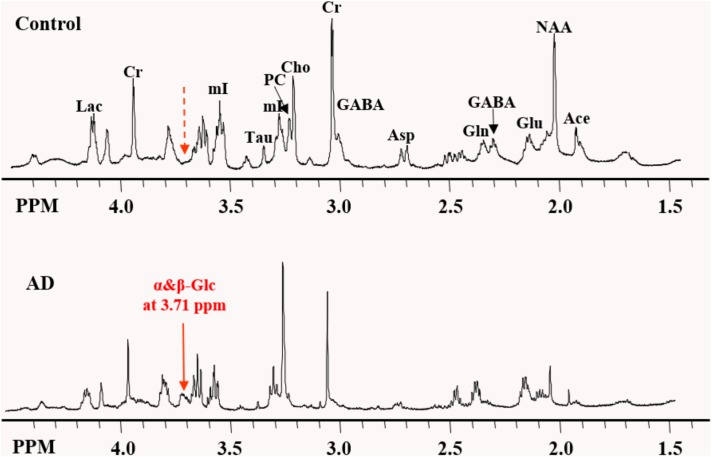
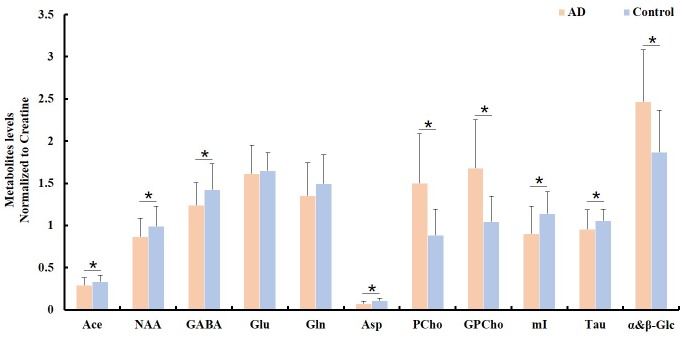
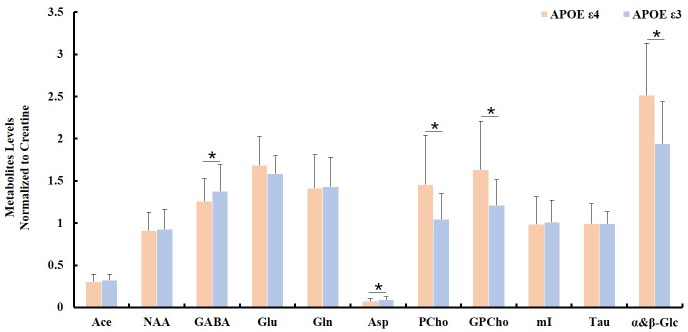
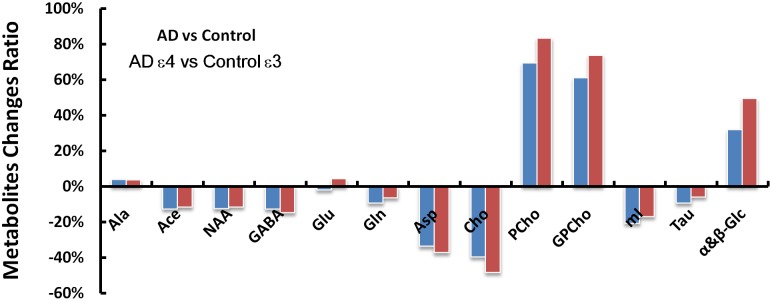
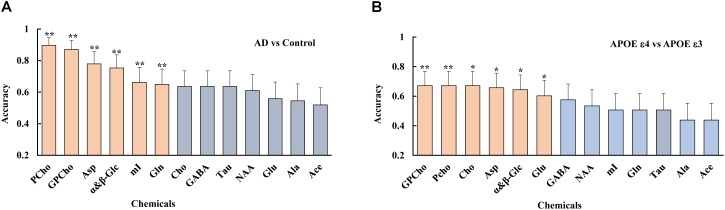
Background: Investigation on neurochemical changes in the frontal cortex in individuals with Alzheimer's disease (AD) and different Apolipoprotein E (APOE) genotypes, using ex vivo solid-state high-resolution NMR analysis, may lead to a better understanding of the neurochemistry associated with AD as well as new AD-specific metabolite biomarkers that might potentially improve the clinical diagnosis of AD. Methods: Intact tissue samples of the frontal cortex were obtained from 11 patients and 11 age-matched non-demented controls. Metabolite profiles in all samples were analyzed ex vivo, using solid-state high-resolution magic angle spinning (HRMAS) 600 MHz 1H nuclear magnetic resonance (NMR). A logistic regression analysis was used to rank metabolites based on their level of contribution in differentiating the AD patient tissues and the controls, and different AD-associated APOE genotypes (APOE ε4 vs. APOE ε3). Results: Tissue samples from the AD patients showed significantly lower NAA/Cr (p = 0.011), Ace/Cr (p = 0.027), GABA/Cr (p = 0.005), Asp/Cr (p < 0.0001), mI/Cr (p < 0.0001), and Tau/Cr (p = 0.021), and higher PCho/Cr (p < 0.0001), GPCho/Cr (p < 0.0001), and α&β-Glc/Cr (p < 0.0001) than the controls did. Specifically, a newly observed resonance at 3.71 ppm, referred to as α&β-Glc, was observed in 90.9% of the AD samples (10/11). Samples with APOE ε4 also exhibited higher PCho/Cr (p = 0.0002), GPCho/Cr (p = 0.0001), α&β-Glc/Cr (p < 0.0001), and lower Asp/Cr (p = 0.004) and GABA/Cr (p = 0.04) than the samples with APOE ε3 did. In the logistic regression analysis, PCho, GPCho, ASP, and α&β-Glc were found to be the most relevant metabolites for differentiating the AD patient tissues and the controls, and different APOE genotypes. Conclusion: HRMAS 1H NMR with high spectral resolution and sensitivity offers a powerful tool to gain quantitative information on AD associated neurochemical changes. There are important neurochemical differences in the frontal cortex between the AD patient tissues and the controls, and between those with different APOE genotypes. The resonance (α&β-Glc) found at 3.71 ppm in the AD patient tissues may be further investigated for its potential in the diagnosis and monitoring of AD.
Keywords: Alzheimer’s disease; brain; metabolic change; neurochemistry; nuclear magnetic resonance.
Figures
Similar articles
-
Cerebrospinal Fluid Amyloid Beta, Tau Levels, Apolipoprotein, and 1H-MRS Brain Metabolites in Alzheimer's Disease: A Systematic Review.Acad Radiol. 2021 Oct;28(10):1447-1463. doi: 10.1016/j.acra.2020.06.006. Epub 2020 Jul 7. Acad Radiol. 2021. PMID: 32651050
-
[Effect of apolipoprotein E genotype on magnetic resonance spectrum in amnestic mild cognitive impairment and Alzheimer's disease patients].Zhonghua Yi Xue Za Zhi. 2019 Apr 16;99(15):1156-1161. doi: 10.3760/cma.j.issn.0376-2491.2019.15.008. Zhonghua Yi Xue Za Zhi. 2019. PMID: 31006219 Chinese.
-
Comparisons of brain metabolites observed by HRMAS 1H NMR of intact tissue and solution 1H NMR of tissue extracts in SIV-infected macaques.NMR Biomed. 2005 Jun;18(4):242-51. doi: 10.1002/nbm.953. NMR Biomed. 2005. PMID: 15759297
-
Decreases in Short Term Memory, IQ, and Altered Brain Metabolic Ratios in Urban Apolipoprotein ε4 Children Exposed to Air Pollution.J Alzheimers Dis. 2015;45(3):757-70. doi: 10.3233/JAD-142685. J Alzheimers Dis. 2015. PMID: 25633678
-
The Neurobiology and Age-Related Prevalence of the ε4 Allele of Apolipoprotein E in Alzheimer's Disease Cohorts.J Mol Neurosci. 2016 Nov;60(3):316-324. doi: 10.1007/s12031-016-0804-x. Epub 2016 Aug 6. J Mol Neurosci. 2016. PMID: 27498201 Free PMC article. Review.
Cited by
-
NMR-based metabolomics in Alzheimer's disease research: a review.Front Mol Biosci. 2023 Nov 30;10:1308500. doi: 10.3389/fmolb.2023.1308500. eCollection 2023. Front Mol Biosci. 2023. PMID: 38099198 Free PMC article. Review.
-
Metabolomic Signatures of Alzheimer's Disease Indicate Brain Region-Specific Neurodegenerative Progression.Int J Mol Sci. 2023 Sep 30;24(19):14769. doi: 10.3390/ijms241914769. Int J Mol Sci. 2023. PMID: 37834217 Free PMC article.
-
Metabolic Profiling of Female Tg2576 Mouse Brains Provides Novel Evidence Supporting Intranasal Low-Dose Pioglitazone for Long-Term Treatment at an Early Stage of Alzheimer's Disease.Biomedicines. 2020 Dec 9;8(12):589. doi: 10.3390/biomedicines8120589. Biomedicines. 2020. PMID: 33317213 Free PMC article.
-
Spatio-temporal metabolic rewiring in the brain of TgF344-AD rat model of Alzheimer's disease.Sci Rep. 2022 Oct 10;12(1):16958. doi: 10.1038/s41598-022-20962-6. Sci Rep. 2022. PMID: 36216838 Free PMC article.
-
Prebiotics modulate the microbiota-gut-brain axis and ameliorate cognitive impairment in APP/PS1 mice.Eur J Nutr. 2023 Oct;62(7):2991-3007. doi: 10.1007/s00394-023-03208-7. Epub 2023 Jul 17. Eur J Nutr. 2023. PMID: 37460822
References
-
- Ball M., Braak H., Coleman P., Dickson D. (1997). Consensus recommendations for the postmortem diagnosis of Alzheimer’s disease. The national institute on aging, and reagan institute working group on diagnostic criteria for the neuropathological assessment of Alzheimer’s disease. Neurobiol. Aging 18(4 Suppl.), S1–S2 - PubMed
-
- Block W., Jessen F., Traber F., Flacke S., Manka C., Lamerichs R., et al. (2002). Regional N-acetylaspartate reduction in the hippocampus detected with fast proton magnetic resonance spectroscopic imaging in patients with Alzheimer disease. Arch. Neurol. 59 828–834. 10.1001/archneur.59.5.828 - DOI - PubMed
LinkOut - more resources
Full Text Sources
Miscellaneous