. 2019 Jan 10:9:1919.
doi: 10.3389/fphys.2018.01919. eCollection 2018.

Self-Reported Fatigue After Mild Traumatic Brain Injury Is Not Associated With Performance Fatigability During a Sustained Maximal Contraction

Affiliations

Self-Reported Fatigue After Mild Traumatic Brain Injury Is Not Associated With Performance Fatigability During a Sustained Maximal Contraction

Roeland F Prak et al. Front Physiol. .

Abstract

Patients with mild traumatic brain injury (mTBI) are frequently affected by fatigue. However, hardly any data is available on the fatigability of the motor system. We evaluated fatigue using the Fatigue Severity Scale (FSS) and Modified Fatigue Impact Scale (MFIS) questionnaires in 20 participants with mTBI (>3 months post injury; 8 females) and 20 age- and sex matched controls. Furthermore, index finger abduction force and electromyography of the first dorsal interosseous muscle of the right hand were measured during brief and sustained maximal voluntary contractions (MVC). Double pulse stimulation (100 Hz) was applied to the ulnar nerve to evoke doublet-forces before and after the sustained contraction. Seven superimposed twitches were evoked during the sustained MVC to quantify voluntary muscle activation. mTBI participants reported higher FSS scores (mTBI: 5.2 ± 0.8 SD vs. control: 2.8 ± 0.8 SD; P < 0.01). During the sustained MVC, force declined to similar levels in mTBI (30.0 ± 9.9% MVC) and control participants (32.7 ± 9.8% MVC, P = 0.37). The decline in doublet-forces after the sustained MVC (mTBI: to 37.2 ± 12.1 vs. control: to 41.4 ± 14.0% reference doublet, P = 0.32) and the superimposed twitches evoked during the sustained MVC (mTBI: median 9.3, range: 2.2-32.9 vs. control: median 10.3, range: 1.9-31.0% doubletpre, P = 0.34) also did not differ between groups. Force decline was associated with decline in doublet-force (R 2 = 0.50, P < 0.01) for both groups. Including a measure of voluntary muscle activation resulted in more explained variance for mTBI participants only. No associations between self-reported fatigue and force decline or voluntary muscle activation were found in mTBI participants. However, the physical subdomain of the MFIS was associated with the decline in doublet-force after the sustained MVC (R 2 = 0.23, P = 0.04). These results indicate that after mTBI, increased levels of self-reported physical fatigue reflected increased fatigability due to changes in peripheral muscle properties, but not force decline or muscle activation. Additionally, muscle activation was more important to explain the decline in voluntary force (performance fatigability) after mTBI than in control participants.

Keywords: first dorsal interosseous; force decline; interpolated twitch technique; mTBI; motor task; voluntary muscle activation.


Figures

FIGURE 1
FIGURE 1
Experimental setup and an example of raw data. (A) Photograph showing the hands a participant equipped with force transducers. The finger bracket is positioned over the proximal interphalangeal joint of the index fingers as can be seen for the left hand. Placement of EMG electrodes over the FDI can be seen for the left hand and electrodes used for electrical stimulation can be seen on the right wrist. (B–D) Panels showing raw data recorded in a male mTBI participant during tasks 1–3, respectively. From top to bottom each panel shows the time-points of electrical nerve stimulation, index finger abduction force of the right hand, EMG of the right FDI, force of the left hand, and EMG of the left FDI. MVC, maximal voluntary contraction; FDI, first dorsal interosseous.
FIGURE 2
FIGURE 2
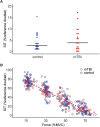
(A) Dot plot showing the size of the superimposed twitches during the maximal voluntary contractions in task 1, values are rounded to the nearest 0.5%. The horizontal line indicates the median for the control participants (blue dots) and mTBI participants (red dots). (B) Superimposed twitches evoked during the submaximal contractions (at 10, 30, 50, and 70% MVC) in task 2. Control data is shown in blue, mTBI in red. A linear regression line is shown for both groups, but no significant differences were observed between control and mTBI participants. SIT, superimposed twitch.
FIGURE 3
FIGURE 3
Time course of the force and rms-EMG of the right hand during the sustained MVC. For all panels, control data (n = 20) is shown in blue and mTBI (n = 20) in red. (A,B) Force (averaged over 2 s epochs) during the sustained MVC in male and female participants. (C,D) Mean rms-EMG (averaged over 2 s epochs) in male and female participants. Error bars in (A–D) show the standard deviation.
FIGURE 4
FIGURE 4
Time course of the superimposed twitches during the sustained MVC. Dots show the mean size of the superimposed twitches evoked before (t = 0 s) and during the sustained MVC (t = 7–115 s). Control data (n = 20) is shown in blue and mTBI (n = 20) in red. Error bars indicate the standard deviation. Superimposed twitches were linearly corrected for the decline in muscle force and expressed as a percentage of the doubletpre.
FIGURE 5
FIGURE 5
Association between scores on the physical subdomain of the MFIS and the decline in the evoked doublet-force after the sustained MVC (i.e., doubletpost). Male mTBI participants (n = 11) are shown in green, female mTBI participants (n = 8) are shown in purple.
FIGURE 6
FIGURE 6
Association between force decline during the sustained MVC and the evoked doublet-force after the sustained contraction (i.e., doubletpost) showing that participants with greater force decline also showed a greater decline in electrically evoked force. Control participants (n = 20) are shown in blue and mTBI (n = 19) in red.

References

    1. Allen D. G., Lamb G. D., Westerblad H. (2008). Skeletal muscle fatigue: cellular mechanisms. Physiol. Rev. 88 287–332. 10.1152/physrev.00015.2007 - DOI - PubMed
    1. Allen G. M., Gandevia S. C., Neering I. R., Hickie I., Jones R., Middleton J. (1994). Muscle performance, voluntary activation and perceived effort in normal subjects and patients with prior poliomyelitis. Brain 117 661–670. 10.1093/brain/117.4.661 - DOI - PubMed
    1. Andriessen T. M. J. C., Jacobs B., Vos P. E. (2010). Clinical characteristics and pathophysiological mechanisms of focal and diffuse traumatic brain injury. J. Cell. Mol. Med. 14 2381–2392. 10.1111/j.1582-4934.2010.01164.x - DOI - PMC - PubMed
    1. Armstrong R. C., Mierzwa A. J., Marion C. M., Sullivan G. M. (2016). White matter involvement after TBI: clues to axon and myelin repair capacity. Exp. Neurol. 275 328–333. 10.1016/j.expneurol.2015.02.011 - DOI - PubMed
    1. Behm D. G., St-Pierre D. M. M., Perez D. (1996). Muscle inactivation: assessment of interpolated twitch technique. J. Appl. Physiol. 81 2267–2273. 10.1152/jappl.1996.81.5.2267 - DOI - PubMed

LinkOut - more resources