. 2019 Jan 10:9:3147.
doi: 10.3389/fimmu.2018.03147. eCollection 2018.

Imbalance of NET and Alpha-1-Antitrypsin in Tuberculosis Patients Is Related With Hyper Inflammation and Severe Lung Tissue Damage

Affiliations

Imbalance of NET and Alpha-1-Antitrypsin in Tuberculosis Patients Is Related With Hyper Inflammation and Severe Lung Tissue Damage

Mayla Gabryele Miranda de Melo et al. Front Immunol. .

Abstract

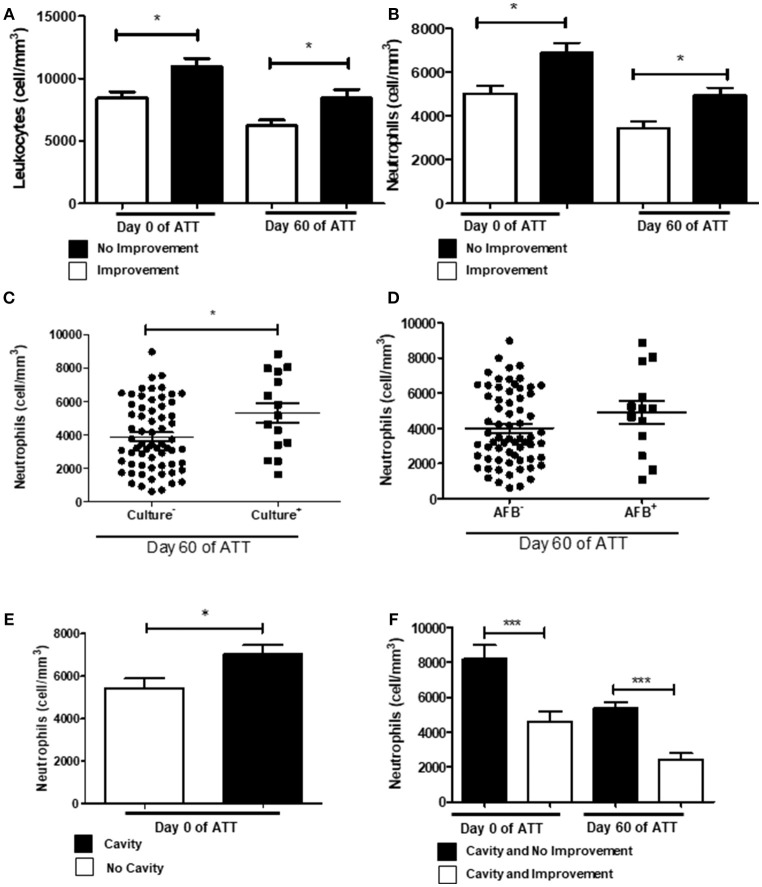
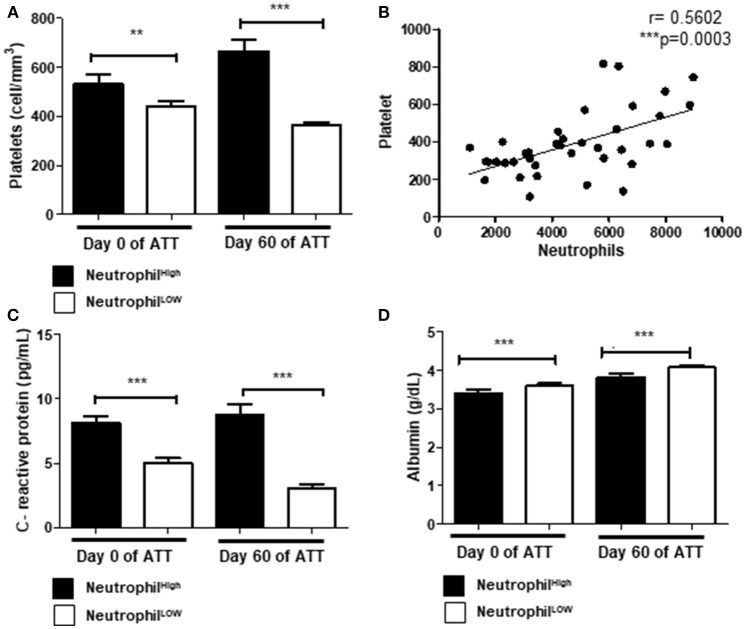
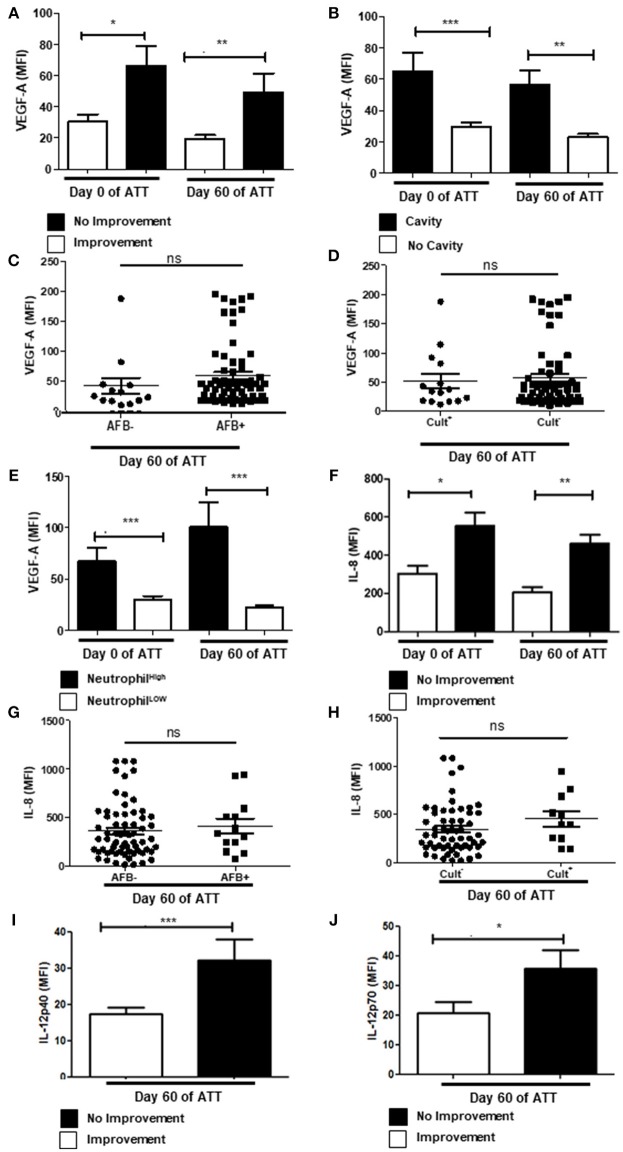
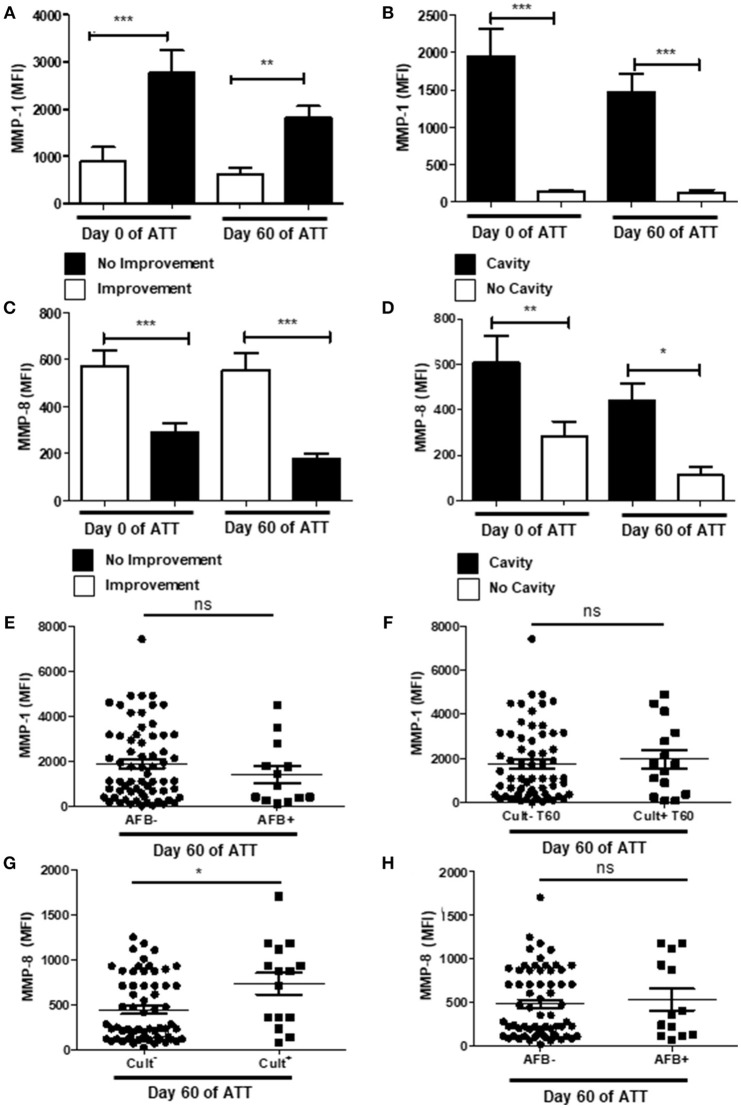
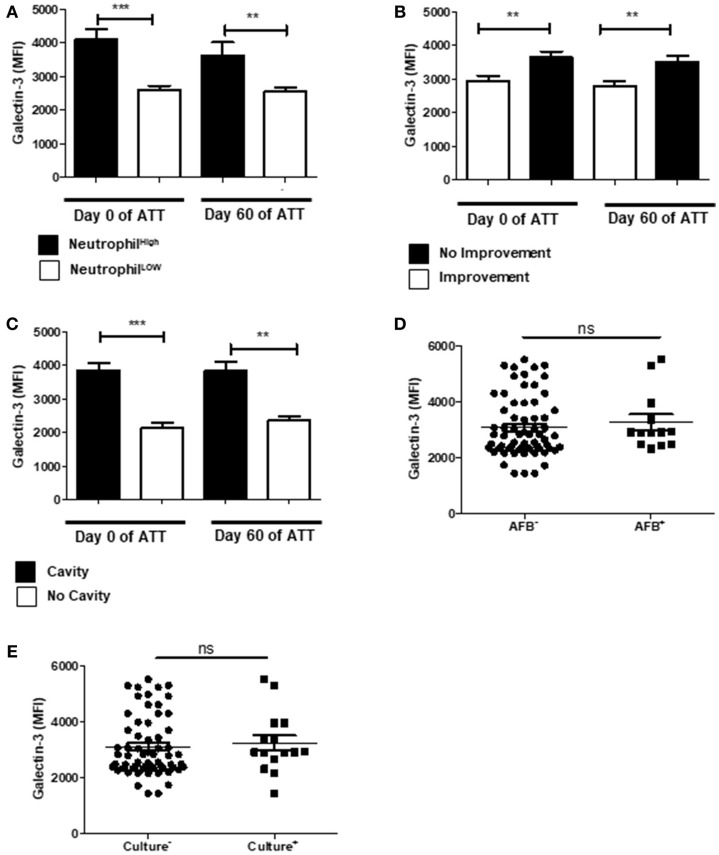
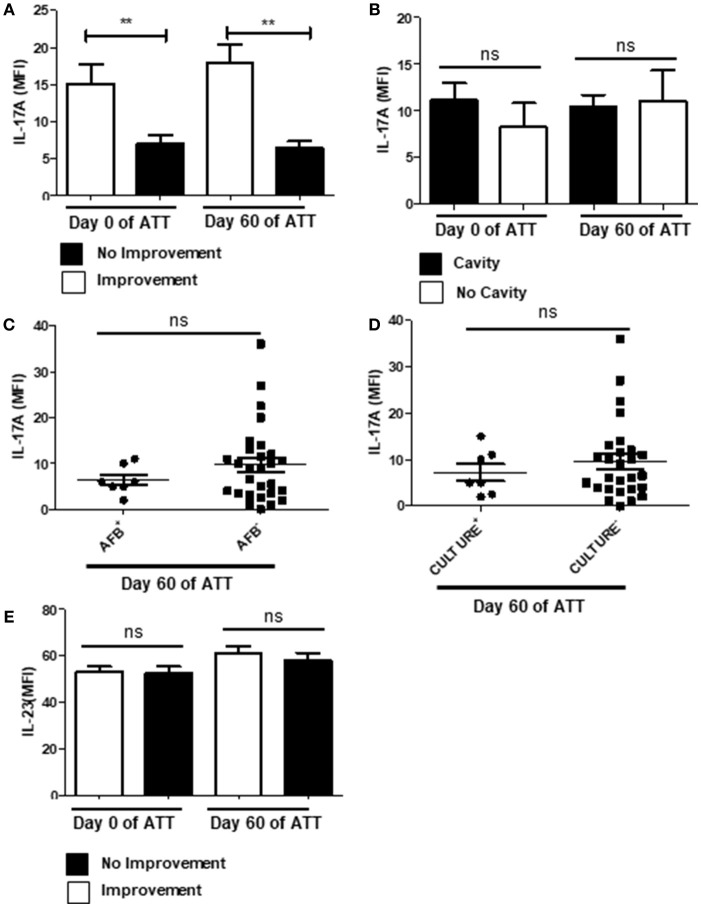
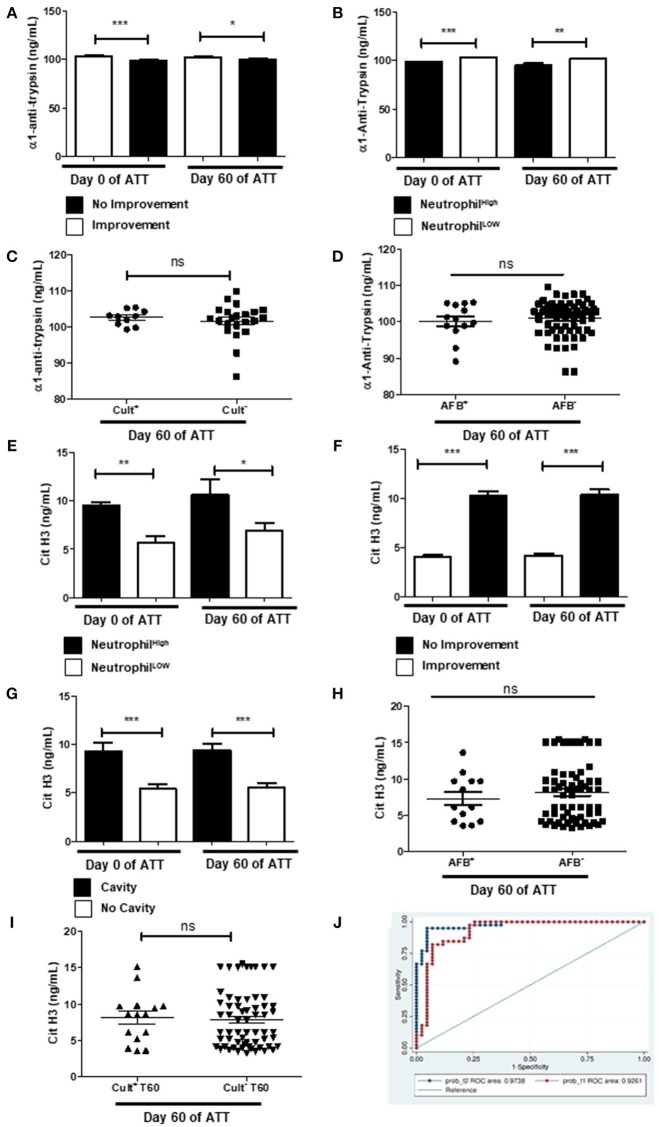
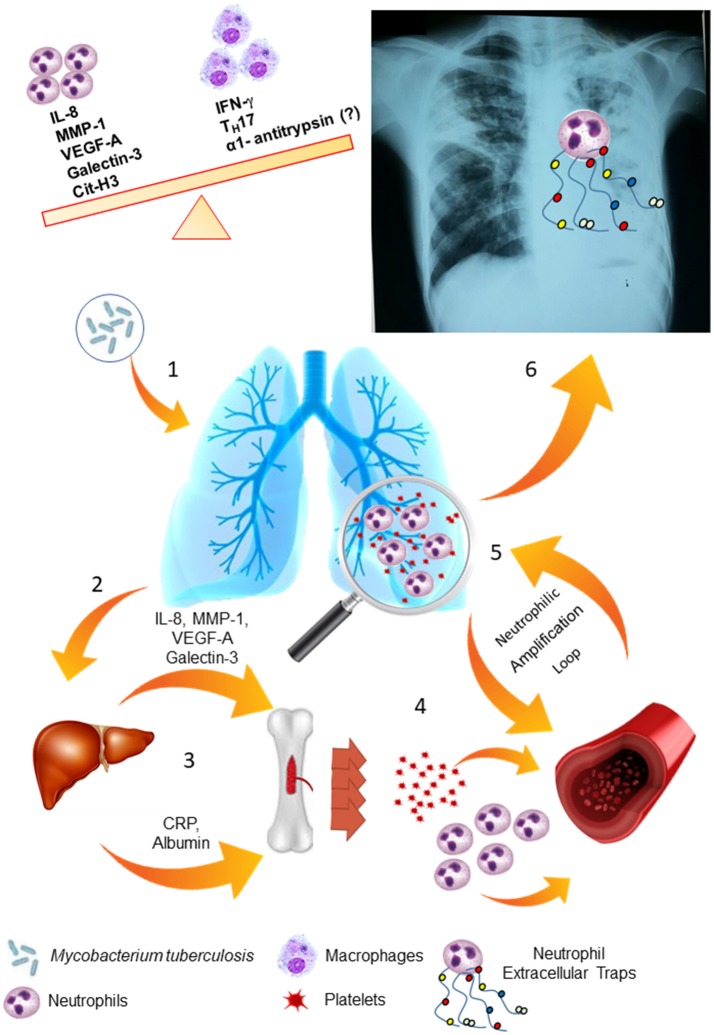
Background: Pulmonary tuberculosis (PTB) can lead to lung tissue damage (LTD) and compromise the pulmonary capacity of TB patients that evolve to severe PTB. The molecular mechanisms involved in LTD during anti-tuberculous treatment (ATT) remain poorly understood. Methods and findings: We evaluated the role of neutrophil extracellular trap (NET) and the occurrence of LTD through chest radiographic images, the microbial load in sputum, and inflammatory serum profile (IL-12p40/p70, IL-8, IL-17A, IL-23, VEGF-A, MMP-1, and -8, galectin-3, citrunillated histone H3-cit-H3, alpha-1-antitrypsin-α1AT, C-reactive protein-CRP and albumin) in a cohort of 82 PTB patients before and after 60 days of ATT. Using univariate analysis, LTD was associated with neutrophilia and increase of several inflammatory proteins involved in the neutrophil-mediated response, being cit-H3 the more related to the event. In the multivariate analysis, neutrophilia and cit-H3 appear as directly related to LTD. The analysis of the ROC curve at day 60 presented AUC of 0.97 (95.0% CI 0.95-1). Interestingly, at day 0 of ATT, these biomarkers demonstrated fine relation with LTD showing an AUC 0.92 (95.0% CI 0.86-0.99). Despite of that, the same molecules have no impact in culture conversion during ATT. Conclusions: Our data revealed that NETs may play a key role in the pathway responsible for non-specific inflammation and tissue destruction in PTB. High level of cit-H3 and low level of α1AT was observed in the serum of severe TB patients, suggesting a breakdown in the intrinsic control of NET-driven tissue damage. These data show a new insight to knowledge TB immunopathogenesis, the role of neutrophil and NET pathway. Likewise, we identified possible biomarkers to screening of PTB patients eligible to adjuvants therapies, as anti-inflammatories and alpha-1-antitrypsin.

Keywords: NET; alpha-1-antitripsin; biomarkers; hyperinflammation; neutrophils; severe pulmonary tuberculosis.


Figures

Figure 1
Figure 1
Neutrophilia and chest X-ray predict no culture conversion. (A) Comparison of leukocytes count between patients who presented or not radiological improvement. (B) Same comparison referred in “A”, with restricted analysis to the neutrophil population. (C,D) Relation of neutrophil counts and conversion of culture and AFB after 60 days of ATT, respectively (E) Relation of neutrophil counts and presence of cavities pre-ATT. (F) Influence of neutrophil counts in T0 and T60 and cavity formation and no radiological improvement after 60 days of ATT. All cell counts were expressed in cells/mm3. Data in each figure are expressed as mean ± SD. *p ≤ 0.05, **p ≤ 0.01 and ***p ≤ 0.0001 by 1-way ANOVA followed by Newman-Keuls test.
Figure 2
Figure 2
Acute phase proteins, neutrophilia and thrombocytosis are associated in LTD (A) Comparison of platelets and neutrophils count before and after 60 days of ATT. (B) Correlation of neutrophils and platelets count (r = 0.5602). (C,D) Relation of neutrophil counts and CRP or albumin, respectively. In (A,C,D), “Neutrophil High” refers to neutrophilia (count ≥ 7,500 cells/mm3) and “Neutrophil Low” refers to normal or low neutrophils count (count < 7,500 cells/mm3). All cell counts were expressed in cells/mm3. CRP and Albumin levels were presented as pg/mL and g/dL, respectively. Data in each figure are expressed as mean ± SD. *p ≤ 0.05, **p ≤ 0.01, and ***p ≤ 0.0001 by 1-way ANOVA followed by Newman-Keuls test.
Figure 3
Figure 3
Neutrophil-related inflammatory proteins are modulated in severe PTB (A) Relation between VEGF-A levels in radiological improvement before and after 60 days of ATT. (B) Same comparison referred in “A”, with restricted analysis to cavity formation. (C,D) Relation of VEGF-A levels and conversion of AFB and culture after 60 days of ATT, respectively (E) Relation of VEGF-A and neutrophil counts. (F) Comparison of IL-8 levels before and after 60 days of ATT in relation to radiological improvement. (G,H) Relation of IL-8 levels and conversion of AFB and culture after 60 days of ATT, respectively. (I,J) Comparison of IL12p40 and IL12p70 levels between patients who presented radiological improvement or not after 60 days of ATT, respectively. All cell counts were expressed in cells/mm3. “Neutrophil High” refers to neutrophilia (count ≥ 7,500 cells/mm3) and “Neutrophil Low” refers to normal or low neutrophils count (count < 7,500 cells/mm3). VEGF-A, IL-8 and IL12 levels are presented as mean fluorescence intensity (MFI). Data in each figure are expressed as mean ± SD. *p ≤ 0.05, **p ≤ 0.01, and ***p ≤ 0.0001 by 1-way ANOVA followed by Newman-Keuls test.
Figure 4
Figure 4
Metalloproteinases are important pieces to enlighten tissue damage mechanism. (A,C) Comparison of MMP-1 and -8 levels before and after 60 days of ATT between patients who presented radiological improvement or not after 60 days of ATT, respectively. (B,D) Same comparison referred in “A” and “C”, respectively, with restricted analysis to cavity formation. (E,F) Relation of MMP-1 levels with AFB and culture conversion, respectively. (G,H) Relation of MMP-8 levels with culture and AFB conversion, respectively. MMP-1 and MMP-8 levels are presented as mean fluorescence intensity (MFI). Data in each figure are expressed as mean ± SD. *p ≤ 0.05, **p ≤ 0.01, and ***p ≤ 0.0001 by 1-way ANOVA followed by Newman-Keuls test.
Figure 5
Figure 5
Galectin-3 is modulated in severe PTB. (A) Relation of Galectin-3 levels and neutrophil counts. “Neutrophil High” refers to neutrophilia (count ≥ 7,500 cells/mm3) and “Neutrophil Low” refers to normal or low neutrophils count (count < 7,500 cells/mm3). (B) Comparison of Galectin-3 levels before and after 60 days of ATT between patients who presented radiological improvement or not after 60 days of ATT. (C) Same comparison referred in “B”, with restricted analysis to cavity formation. (D,E) Relation of Galectin-3 levels and conversion of AFB and culture after 60 days of ATT, respectively. Galectin-3 levels are presented as mean fluorescence intensity (MFI). Data in each figure are expressed as mean ± SD. *p ≤ 0.05, **p ≤ 0.01, and ***p ≤ 0.0001 by 1-way ANOVA followed by Newman-Keuls test.
Figure 6
Figure 6
PTB showed IL-17 downregulation related with LTD no improvement. (A) Comparison of IL-17 levels before and after 60 days of ATT between patients who presented radiological improvement or not after 60 days of ATT. (B) Comparison of IL-17 levels in patients who presented or not cavity formation. (C,D) Relation of IL-17 levels with AFB and culture conversion, respectively. (E) Serum IL-23 IL-17 levels are presented as mean fluorescence intensity (MFI). Data in each figure are expressed as mean ± SD. **p ≤ 0.01 by 1-way ANOVA followed by Newman-Keuls test.
Figure 7
Figure 7
NET is the main pathway to LTD in severe PTB (A) Evaluation of alpha-1-antitrypsin (α1AT) levels before and after 60 days of ATT inpatients with radiological improvement or not after 60 days of ATT. (B) Relation of α1AT levels and neutrophil counts. (C,D) Relation of α1AT levels with culture and AFB conversion, respectively. (E) Relation of citrullinated histone H3 (cit-H3) levels and neutrophil counts. (F) Comparison of cit-H3 levels before and after 60 days of ATT between patients who presented radiological improvement or not after 60 days of ATT. (G) Comparison of cit-H3 levels in patients who presented or not cavity formation. (H,I) Relation of α1AT levels with AFB and culture conversion, respectively. In graphs “B” and “E”, “Neutrophil High” refers to neutrophilia (count ≥ 7,500 cells/mm3) and “Neutrophil Low” refers to normal or low neutrophils count (count < 7,500 cells/mm3). α1AT and cit-H3 levels are presented as ng/mL. Data in each figure are expressed as mean ± SD. *p ≤ 0.05, **p ≤ 0.01 and ***p ≤ 0.0001 by 1-way ANOVA followed by Newman-Keuls test. (J) Overlay of ROC curve at day 0 and 60 of ATT, revealed that only neutrophil, cit-H3 and α1AT day showing are related with LTD in PTB. The logistic regression model was built using STATA 14 and the strongest significant predictors variables were selected with a p < 0.05.
Figure 8
Figure 8
LTD is based on the maintenance of the neutrophilic response and its amplification loops. (1) Mycobacterium tuberculosis infects the lung tissue and generates an inflammatory response through primary infection or reactivation of latent TB infection. (2) Several soluble molecules, such as VEGF-A, MMP-1, Galectin-3 and IL-8 are released in the site of infection and modulate the liver. (3) Liver-produced acute phase proteins (CRP and albumin) and soluble molecules from the infection site modulate the bone marrow. (4) In response to these stimuli, the bone marrow mobilize neutrophils and platelets to the blood flow and enhance the production of these cells. (5) These cells are attracted to the lung tissue, where they are activated and produce larger amounts of VEGF-A, IL-8 and MMP-1, maintaining the response in an amplification loop. (6) Neutrophils are activated by platelets and release Neutrophils Extracellular Traps (NETs), which contains MMP-8 and elastase, and lead to lung tissue damage.

References

    1. World Health Organization Global Tuberculosis Report Geneva: (2017).
    1. Kim HY, Song KS, Goo JM, Lee JS, Lee KS, Lim TH. Thoracic sequelae and complications of tuberculosis. Radiographics (2001) 21:839–54. 10.1148/radiographics.21.4.g01jl06839 - DOI - PubMed
    1. Pasipanodya JG, McNabb SJ, Hilsenrath P, Bae S, Lykens K, Vecino E, et al. . Pulmonary impairment after tuberculosis and its contribution to TB burden. BMC Public Health (2010) 10:259. 10.1186/1471-2458-10-259 - DOI - PMC - PubMed
    1. Hnizdo E, Singh T, Churchyard G. Chronic pulmonary function impairment caused by initial and recurrent pulmonary tuberculosis following treatment. Thorax (2000) 55:32–8. 10.1136/thorax.55.1.32 - DOI - PMC - PubMed
    1. Shah M, Reed C. Complications of tuberculosis. Curr Opin Infect Dis. (2014) 27:403–10. 10.1097/QCO.0000000000000090 - DOI - PubMed

Publication types

MeSH terms