

Genome-Wide Variation, Candidate Regions and Genes Associated With Fat Deposition and Tail Morphology in Ethiopian Indigenous Sheep
- PMID: 30687385
- PMCID: PMC6334744
- DOI: 10.3389/fgene.2018.00699
Genome-Wide Variation, Candidate Regions and Genes Associated With Fat Deposition and Tail Morphology in Ethiopian Indigenous Sheep
Abstract
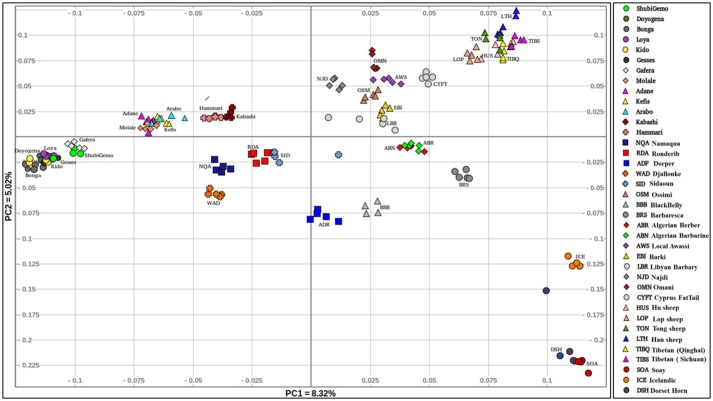
Variations in body weight and in the distribution of body fat are associated with feed availability, thermoregulation, and energy reserve. Ethiopia is characterized by distinct agro-ecological and human ethnic farmer diversity of ancient origin, which have impacted on the variation of its indigenous livestock. Here, we investigate autosomal genome-wide profiles of 11 Ethiopian indigenous sheep populations using the Illumina Ovine 50 K SNP BeadChip assay. Sheep from the Caribbean, Europe, Middle East, China, and western, northern and southern Africa were included to address globally, the genetic variation and history of Ethiopian populations. Population relationship and structure analysis separated Ethiopian indigenous fat-tail sheep from their North African and Middle Eastern counterparts. It indicates two main genetic backgrounds and supports two distinct genetic histories for African fat-tail sheep. Within Ethiopian sheep, our results show that the short fat-tail sheep do not represent a monophyletic group. Four genetic backgrounds are present in Ethiopian indigenous sheep but at different proportions among the fat-rump and the long fat-tail sheep from western and southern Ethiopia. The Ethiopian fat-rump sheep share a genetic background with Sudanese thin-tail sheep. Genome-wide selection signature analysis identified eight putative candidate regions spanning genes influencing growth traits and fat deposition (NPR2, HINT2, SPAG8, INSR), development of limbs and skeleton, and tail formation (ALX4, HOXB13, BMP4), embryonic development of tendons, bones and cartilages (EYA2, SULF2), regulation of body temperature (TRPM8), body weight and height variation (DIS3L2), control of lipogenesis and intracellular transport of long-chain fatty acids (FABP3), the occurrence and morphology of horns (RXFP2), and response to heat stress (DNAJC18). Our findings suggest that Ethiopian fat-tail sheep represent a uniquely admixed but distinct genepool that presents an important resource for understanding the genetic control of skeletal growth, fat metabolism and associated physiological processes.
Keywords: Africa; Ovis aries; admixture; fat-tail; thin-tail.
Figures


References
-
- Assefa F., Tigistu T., Lambebo A. (2015). Assessment of the production system, major constraints and opportunities of sheep production in doyogena woreda, kembata tambaro zone, southern ethiopia. J Biol Agric Healthc. 5, 37–41. Available online at: https://iiste.org/Journals/index.php/JBAH/article/view/27068
-
- Atti N., Bocquier F., Khaldi G. (2004). Performance of the fat-tailed Barbarine sheep in its environment: adaptive capacity to alternation of underfeeding and re-feeding periods. Rev. Anim. Res. 53, 165–176. 10.1051/animres:2004012 - DOI
LinkOut - more resources
Full Text Sources
Miscellaneous