. 2019 Jan 22;5(1):vey039.
doi: 10.1093/ve/vey039. eCollection 2019 Jan.

Evidence for a recombinant origin of HIV-1 Group M from genomic variation

Affiliations

Evidence for a recombinant origin of HIV-1 Group M from genomic variation

Abayomi S Olabode et al. Virus Evol. .

Abstract

Reconstructing the early dynamics of the HIV-1 pandemic can provide crucial insights into the socioeconomic drivers of emerging infectious diseases in human populations, including the roles of urbanization and transportation networks. Current evidence indicates that the global pandemic comprising almost entirely of HIV-1/M originated around the 1920s in central Africa. However, these estimates are based on molecular clock estimates that are assumed to apply uniformly across the virus genome. There is growing evidence that recombination has played a significant role in the early history of the HIV-1 pandemic, such that different regions of the HIV-1 genome have different evolutionary histories. In this study, we have conducted a dated-tip analysis of all near full-length HIV-1/M genome sequences that were published in the GenBank database. We used a sliding window approach similar to the 'bootscanning' method for detecting breakpoints in inter-subtype recombinant sequences. We found evidence of substantial variation in estimated root dates among windows, with an estimated mean time to the most recent common ancestor of 1922. Estimates were significantly autocorrelated, which was more consistent with an early recombination event than with stochastic error variation in phylogenetic reconstruction and dating analyses. A piecewise regression analysis supported the existence of at least one recombination breakpoint in the HIV-1/M genome with interval-specific means around 1929 and 1913, respectively. This analysis demonstrates that a sliding window approach can accommodate early recombination events outside the established nomenclature of HIV-1/M subtypes, although it is difficult to incorporate the earliest available samples due to their limited genome coverage.

Keywords: HIV-1; molecular clock; network clustering; phylogenetics; recombination; subtype diversity.


Figures
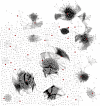
Figure 1.
Figure 1.
Network diagram representing the clustering of HIV-1 near full-length sequences into communities of genetically similar genomes. Each point (node) represents an HIV-1 genome sequence, and each connection (edge) indicates that the respective nodes have a pairwise k-mer distance below the threshold. Larger (red) nodes represent sequences with the maximum degree-size centrality in their respective network communities; these sequences were in a MSA to generate a draft consensus genome sequence.
Figure 2.
Figure 2.
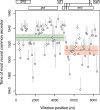
Origin of HIV-1/M based on LSD. The y-axis represents the estimated root dates (tMRCAs) for sequences in each window. The x-axis represents the genomic coordinates with each position corresponding to a gene region on the HIV-1 genome map at the top of the plot region. Each point represents data for a sliding window of 500 nt per sequence. The gray lines represent the 95% CI for each date estimate. The green and red lines indicate the breakpoint fragments computed using a piecewise linear regression model.
Figure 3.
Figure 3.
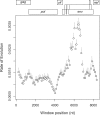
HIV-1/M substitution rate estimates based on LSD. The y-axis represents rates of substitution for sequences in each window. The x-axis represents the genomic coordinates with each position corresponding to a gene region on the HIV-1 genome map at the top. Each point represents data for a sliding window of 500 nt per sequence. The gray lines represent the 95% CI for each rate estimate.
Figure 4.
Figure 4.
Bayesian skyline plots for all eighty-two windows in the HIV-1/M genome alignment. The vertical axis corresponds to mean estimates of the effective number of infections, which is roughly proportional to incidence. The horizontal axis represents the number of years prior to the most recent sample. Each trend line corresponds to a different window, whose location is indicated by color (see inset legend and genome diagram); in sum, the blue lines correspond to windows closer to the 5’ end of the genome, and red lines to windows closer to the 3’ end. Tickmarks along the horizontal axis represent the median estimate of the tMRCA for each window (see also Fig. 4).

Similar articles

Cited by

References

    1. Abecasis A. B. et al. (2007) ‘Recombination Confounds the Early Evolutionary History of Human Immunodeficiency Virus Type 1: Subtype G Is a Circulating Recombinant Form’, Journal of Virology, 81: 8543–51. - PMC - PubMed
    1. Alizon S., Fraser C. (2013) ‘Within-host and between-host Evolutionary Rates across the HIV-1 Genome’, Retrovirology, 10: 49. - PMC - PubMed
    1. Anderson T. K. et al. (2012) ‘Ranking Viruses: Measures of Positional Importance within Networks Define Core Viruses for Rational Polyvalent Vaccine Development’, Bioinformatics, 28: 1624–32. - PubMed
    1. Archer J. et al. (2008) ‘Identifying the Important HIV-1 Recombination Breakpoints’, PLoS Computational Biology, 4: e1000178. - PMC - PubMed
    1. Drummond A. J. et al. (2006) ‘Relaxed Phylogenetics and Dating with Confidence’, PLoS Biology, 4: e88. - PMC - PubMed