

Intact HIV-1 proviruses accumulate at distinct chromosomal positions during prolonged antiretroviral therapy
- PMID: 30688658
- PMCID: PMC6391088
- DOI: 10.1172/JCI124291
Intact HIV-1 proviruses accumulate at distinct chromosomal positions during prolonged antiretroviral therapy
Abstract
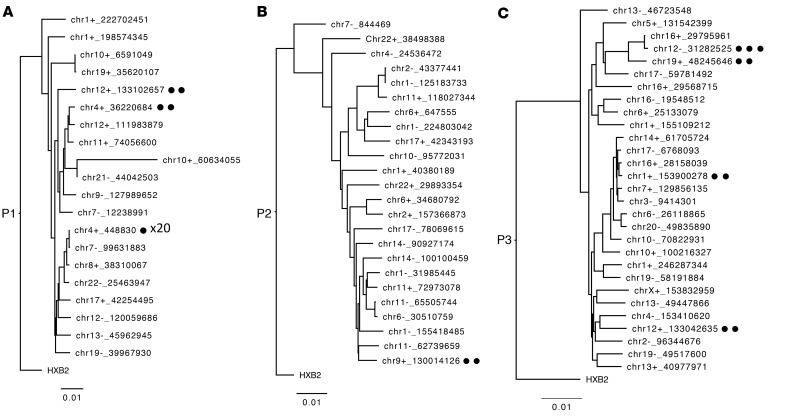
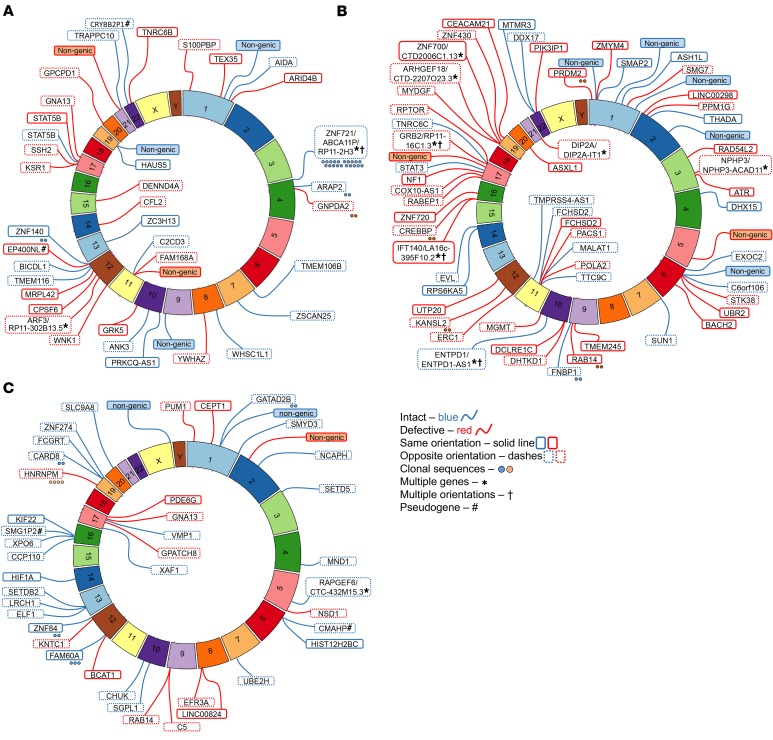
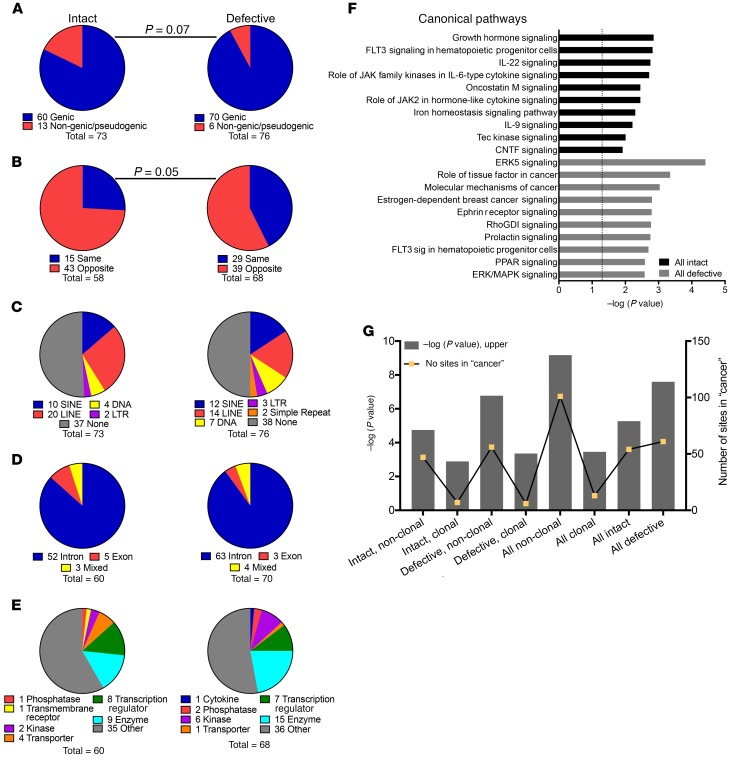
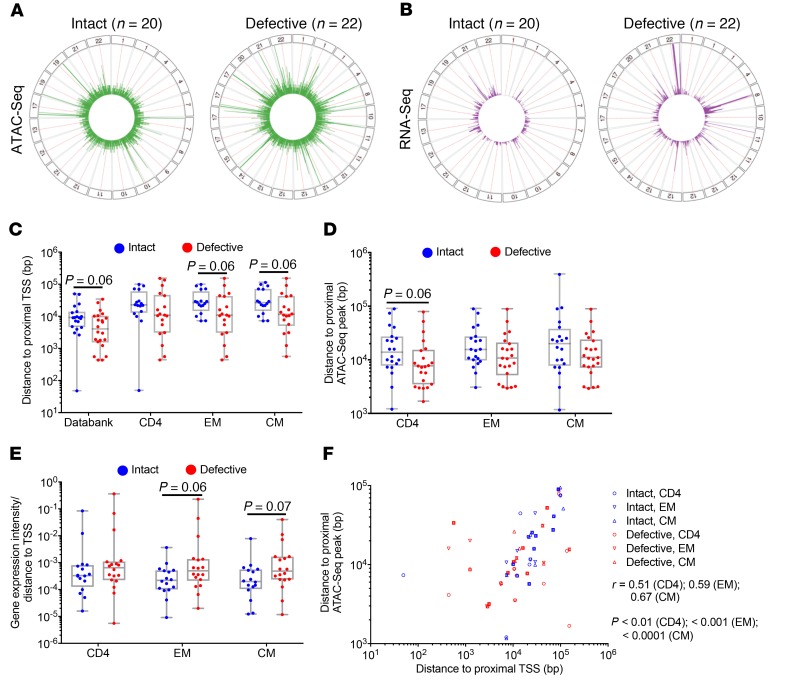
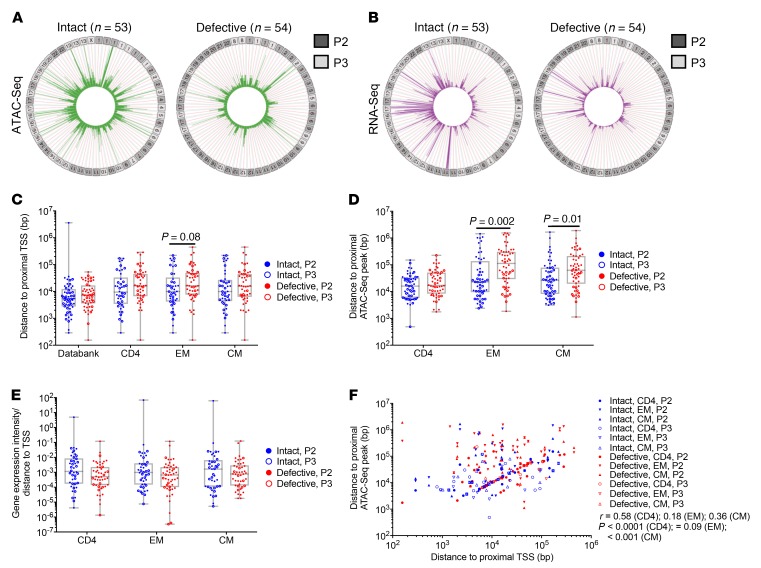
Chromosomal integration of genome-intact HIV-1 sequences into the host genome creates a reservoir of virally infected cells that persists throughout life, necessitating indefinite antiretroviral suppression therapy. During effective antiviral treatment, the majority of these proviruses remain transcriptionally silent, but mechanisms responsible for viral latency are insufficiently clear. Here, we used matched integration site and proviral sequencing (MIP-Seq), an experimental approach involving multiple displacement amplification of individual proviral species, followed by near-full-length HIV-1 next-generation sequencing and corresponding chromosomal integration site analysis to selectively map the chromosomal positions of intact and defective proviruses in 3 HIV-1-infected individuals undergoing long-term antiretroviral therapy. Simultaneously, chromatin accessibility and gene expression in autologous CD4+ T cells were analyzed by assays for transposase-accessible chromatin using sequencing (ATAC-Seq) and RNA-Seq. We observed that in comparison to proviruses with defective sequences, intact HIV-1 proviruses were enriched for non-genic chromosomal positions and more frequently showed an opposite orientation relative to host genes. In addition, intact HIV-1 proviruses were preferentially integrated in either relative proximity to or increased distance from active transcriptional start sites and to accessible chromatin regions. These studies strongly suggest selection of intact proviruses with features of deeper viral latency during prolonged antiretroviral therapy, and may be informative for targeting the genome-intact viral reservoir.
Keywords: AIDS/HIV; Infectious disease; T cells.
Conflict of interest statement
Figures
Similar articles
-
Deep Sequencing Analysis of Individual HIV-1 Proviruses Reveals Frequent Asymmetric Long Terminal Repeats.J Virol. 2022 Jul 13;96(13):e0012222. doi: 10.1128/jvi.00122-22. Epub 2022 Jun 8. J Virol. 2022. PMID: 35674431 Free PMC article.
-
Intact HIV Proviruses Persist in Children Seven to Nine Years after Initiation of Antiretroviral Therapy in the First Year of Life.J Virol. 2020 Jan 31;94(4):e01519-19. doi: 10.1128/JVI.01519-19. Print 2020 Jan 31. J Virol. 2020. PMID: 31776265 Free PMC article.
-
New Approaches to Multi-Parametric HIV-1 Genetics Using Multiple Displacement Amplification: Determining the What, How, and Where of the HIV-1 Reservoir.Viruses. 2021 Dec 10;13(12):2475. doi: 10.3390/v13122475. Viruses. 2021. PMID: 34960744 Free PMC article. Review.
-
Distinct viral reservoirs in individuals with spontaneous control of HIV-1.Nature. 2020 Sep;585(7824):261-267. doi: 10.1038/s41586-020-2651-8. Epub 2020 Aug 26. Nature. 2020. PMID: 32848246 Free PMC article.
-
The role of integration and clonal expansion in HIV infection: live long and prosper.Retrovirology. 2018 Oct 23;15(1):71. doi: 10.1186/s12977-018-0448-8. Retrovirology. 2018. PMID: 30352600 Free PMC article. Review.
Cited by
-
Genetic Diversity, Compartmentalization, and Age of HIV Proviruses Persisting in CD4+ T Cell Subsets during Long-Term Combination Antiretroviral Therapy.J Virol. 2020 Feb 14;94(5):e01786-19. doi: 10.1128/JVI.01786-19. Print 2020 Feb 14. J Virol. 2020. PMID: 31776273 Free PMC article.
-
Advances in Pediatric HIV-1 Cure Therapies and Reservoir Assays.Viruses. 2022 Nov 23;14(12):2608. doi: 10.3390/v14122608. Viruses. 2022. PMID: 36560612 Free PMC article. Review.
-
The Quest for Cellular Markers of HIV Reservoirs: Any Color You Like.Front Immunol. 2019 Sep 20;10:2251. doi: 10.3389/fimmu.2019.02251. eCollection 2019. Front Immunol. 2019. PMID: 31616425 Free PMC article. Review.
-
Pharmacological Modulation of the Wnt/β-Catenin Pathway Inhibits Proliferation and Promotes Differentiation of Long-Lived Memory CD4+ T Cells in Antiretroviral Therapy-Suppressed Simian Immunodeficiency Virus-Infected Macaques.J Virol. 2019 Dec 12;94(1):e01094-19. doi: 10.1128/JVI.01094-19. Print 2019 Dec 12. J Virol. 2019. PMID: 31619550 Free PMC article.
-
Tissue memory CD4+ T cells expressing IL-7 receptor-alpha (CD127) preferentially support latent HIV-1 infection.PLoS Pathog. 2020 Apr 30;16(4):e1008450. doi: 10.1371/journal.ppat.1008450. eCollection 2020 Apr. PLoS Pathog. 2020. PMID: 32353080 Free PMC article.
References
Publication types
MeSH terms
Substances
Grants and funding
- UM1 AI126620/AI/NIAID NIH HHS/United States
- R01 HL134539/HL/NHLBI NIH HHS/United States
- U01 AI114235/AI/NIAID NIH HHS/United States
- R01 AI098487/AI/NIAID NIH HHS/United States
- R61 DA047034/DA/NIDA NIH HHS/United States
- R01 AI130005/AI/NIAID NIH HHS/United States
- R33 AI116228/AI/NIAID NIH HHS/United States
- R33 AI122377/AI/NIAID NIH HHS/United States
- R21 AI124776/AI/NIAID NIH HHS/United States
- R01 AI120008/AI/NIAID NIH HHS/United States
- R21 AI116228/AI/NIAID NIH HHS/United States
- P30 AI060354/AI/NIAID NIH HHS/United States
- R21 AI122377/AI/NIAID NIH HHS/United States
- R01 AI078799/AI/NIAID NIH HHS/United States
- U01 AI117841/AI/NIAID NIH HHS/United States
- R01 DK120387/DK/NIDDK NIH HHS/United States
- R56 AI125109/AI/NIAID NIH HHS/United States
LinkOut - more resources
Full Text Sources
Other Literature Sources
Medical
Molecular Biology Databases
Research Materials
