

Impact of a combination of quantitative indices representing uptake intensity, shape, and asymmetry in DAT SPECT using machine learning: comparison of different volume of interest settings
- PMID: 30689072
- PMCID: PMC6890908
- DOI: 10.1186/s13550-019-0477-x
Impact of a combination of quantitative indices representing uptake intensity, shape, and asymmetry in DAT SPECT using machine learning: comparison of different volume of interest settings
Abstract
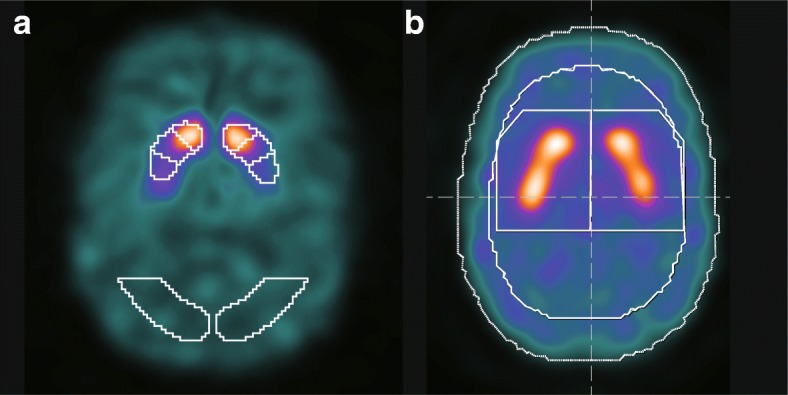
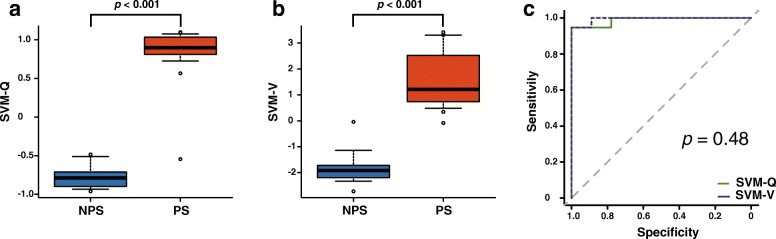
Background: We sought to assess the machine learning-based combined diagnostic accuracy of three types of quantitative indices obtained using dopamine transporter single-photon emission computed tomography (DAT SPECT)-specific binding ratio (SBR), putamen-to-caudate ratio (PCR)/fractal dimension (FD), and asymmetry index (AI)-for parkinsonian syndrome (PS). We also aimed to compare the effect of two different types of volume of interest (VOI) settings from commercially available software packages DaTQUANT (Q) and DaTView (V) on diagnostic accuracy.
Methods: Seventy-one patients with PS and 40 without PS (NPS) were enrolled. Using SPECT images obtained from these patients, three quantitative indices were calculated at two different VOI settings each. SBR-Q, PCR-Q, and AI-Q were derived using the VOI settings from DaTQUANT, whereas SBR-V, FD-V, and AI-V were derived using those from DaTView. We compared the diagnostic value of these six indices for PS. We incorporated a support vector machine (SVM) classifier for assessing the combined accuracy of the three indices (SVM-Q: combination of SBR-Q, PCR-Q, and AI-Q; SVM-V: combination of SBR-V, FD-V, and AI-V). A Mann-Whitney U test and receiver-operating characteristics (ROC) analysis were used for statistical analyses.
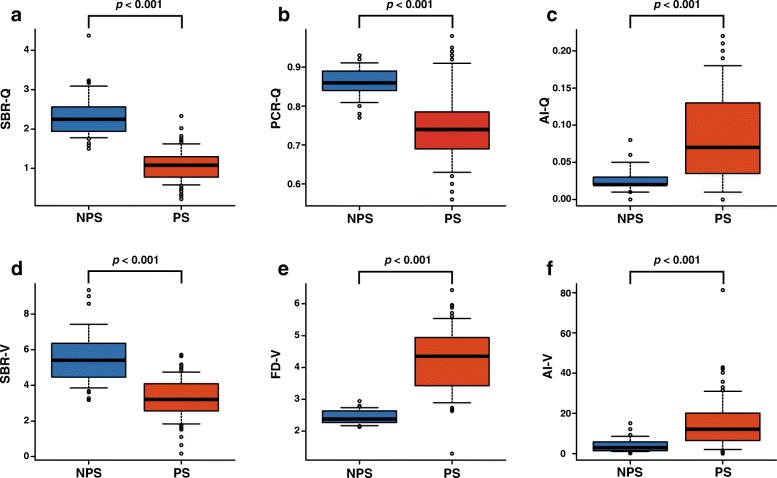
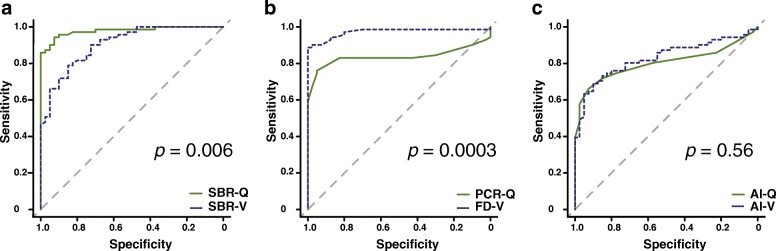
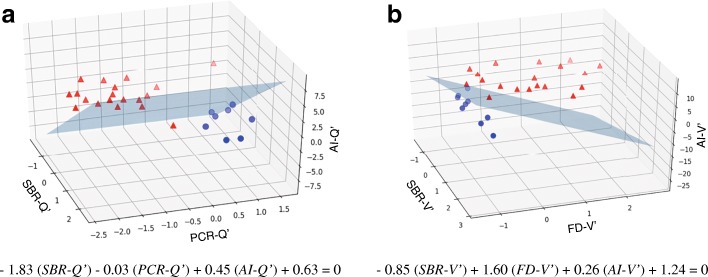
Results: ROC analyses demonstrated that the areas under the curve (AUC) for SBR-Q, PCR-Q, AI-Q, SBR-V, FD-V, and AI-V were 0.978, 0.837, 0.802, 0.906, 0.972, and 0.829, respectively. On comparing the corresponding quantitative indices between the two types of VOI settings, SBR-Q performed better than SBR-V (p = 0.006), whereas FD-V performed better than PCR-Q (p = 0.0003). No significant difference was observed between AI-Q and AI-V (p = 0.56). The AUCs for SVM-Q and SVM-V were 0.988 and 0.994, respectively; the two different VOI settings displayed no significant differences in terms of diagnostic accuracy (p = 0.48).
Conclusion: The combination of the three indices obtained using the SVM classifier improved the diagnostic performance for PS; this performance did not differ based on the VOI settings and software used.
Keywords: 123I-FP-CIT; 123I-Ioflupane; DAT SPECT; Machine learning; Parkinson’s syndrome; Support vector machine.
Conflict of interest statement
TN and MJ received research grants from Nihon Medi-Physics Co., Ltd. and GE Healthcare Corp. MK received a research grant from Nihon Medi-Physics Co., Ltd. The authors declare that they have no competing interests.
Figures
References
-
- Varrone A, Dickson JC, Tossici-Bolt L, Sera T, Asenbaum S, Booij J, et al. European multicentre database of healthy controls for [123I]FP-CIT SPECT (ENC-DAT): age-related effects, gender differences and evaluation of different methods of analysis. Eur J Nucl Med Mol Imaging. 2013;40:213–27. - PubMed
-
- Koch W, Radau PE, Hamann C, Tatsch K. Clinical testing of an optimized software solution for an automated, observer-independent evaluation of dopamine transporter SPECT studies. J Nucl Med. 2005;46:1109–1118. - PubMed
LinkOut - more resources
Full Text Sources
